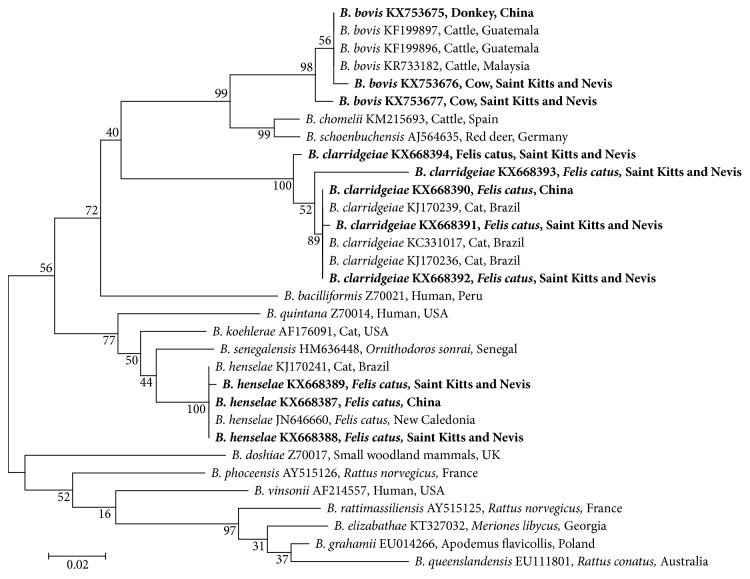
Figure 3.
Molecular phylogenetic analysis of Bartonella spp. in this study. Distances and groupings of Bartonella spp. detected in this study (bold font) and reference Bartonella sequences from NCBI were determined by the maximum likelihood and Bayesian inference method with the MEGA version 6 software based on the gltA gene (439 bp). Bootstrap values were calculated using 500 replicates. Scale bar indicates a genetic distance of 0.02 nt substitutions per position.

