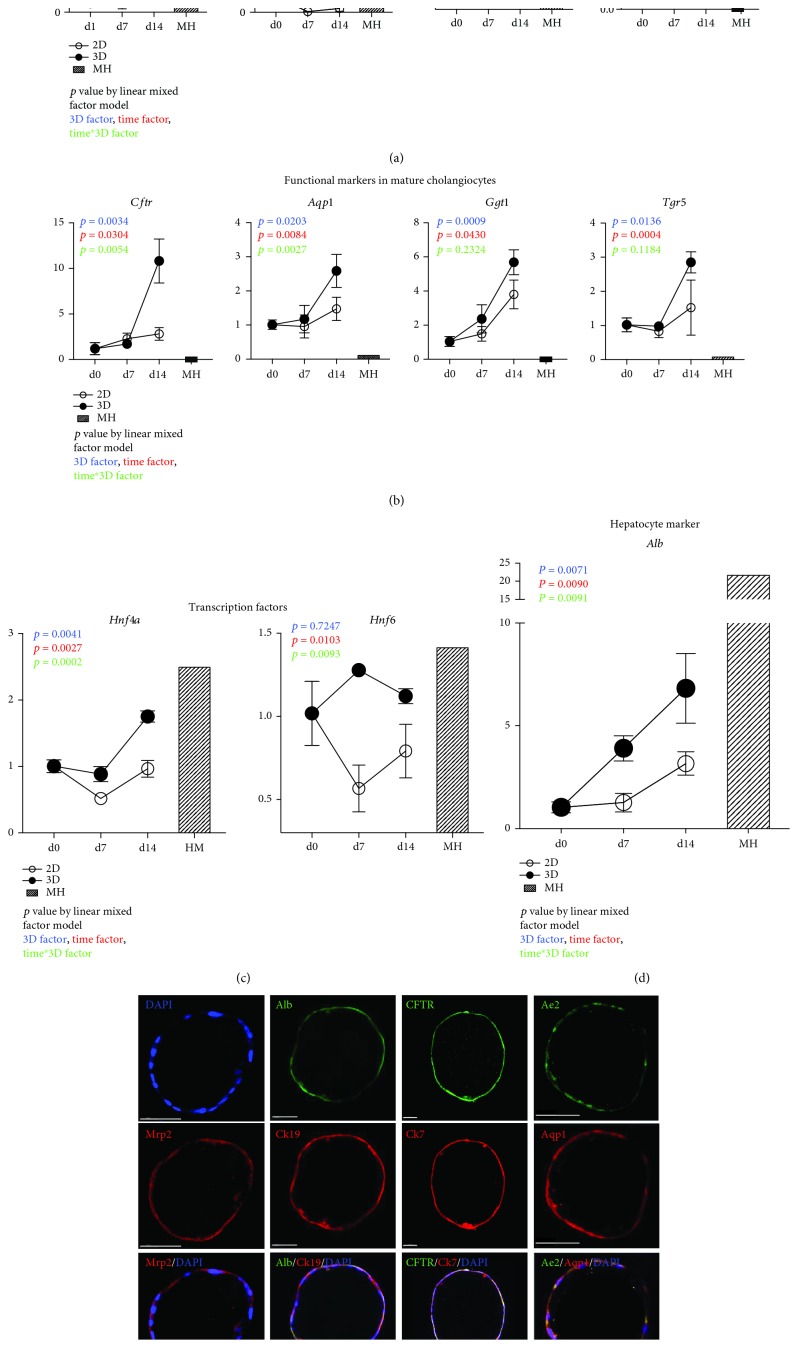
Figure 2.
Spontaneously formed 3D cysts are biphenotypic (see also ). (a) Time course expression profiles of hepatic uptake transporter (Oatp2 and Pept1) and efflux transporter (Mrp2 and Bsep) genes in samples from 3D cysts and 2D monolayer cultures were assessed using quantitative reverse transcriptase-polymerase chain reaction (qRT-PCR) analyses. (b) Time course expression profiles of functional marker expression levels in mature cholangiocytes (Cftr, Aqp1, Tgr5, and Ggt1) from samples of 3D cysts and 2D cell monolayers were assessed using qRT-PCR analysis. (c) Time course of expression levels of the hepatic transcription factors Hnf4a and Hnf6 in samples from 3D cyst and 2D monolayer cells were assessed using qRT-PCR analyses. (d) Time course expression profiles of hepatic marker Albumin (Alb). Data are shown as means ± s.d. of three experiments. Values were normalized to those of Gapdh and are presented as fold changes relative to an expression level of 1 at day 0; the primary mature hepatocytes (MH) were also labeled. p values were calculated using a linear mixed model to account for the covariant structures that follow repeated measures at different time points. The color descriptors are described in the figure. Differences were identified using two-way ANOVA. (e) Immunocytochemical analyses of 3D cysts at day 14 showing expression levels of the epithelial cell markers Ck19 and Ck7, the hepatic marker albumin (Alb), the hepatocyte transporter Mrp2, and the mature cholangiocytic markers CFTR, Aqp1, and Ae2 (see also the supplemental videos for details).

