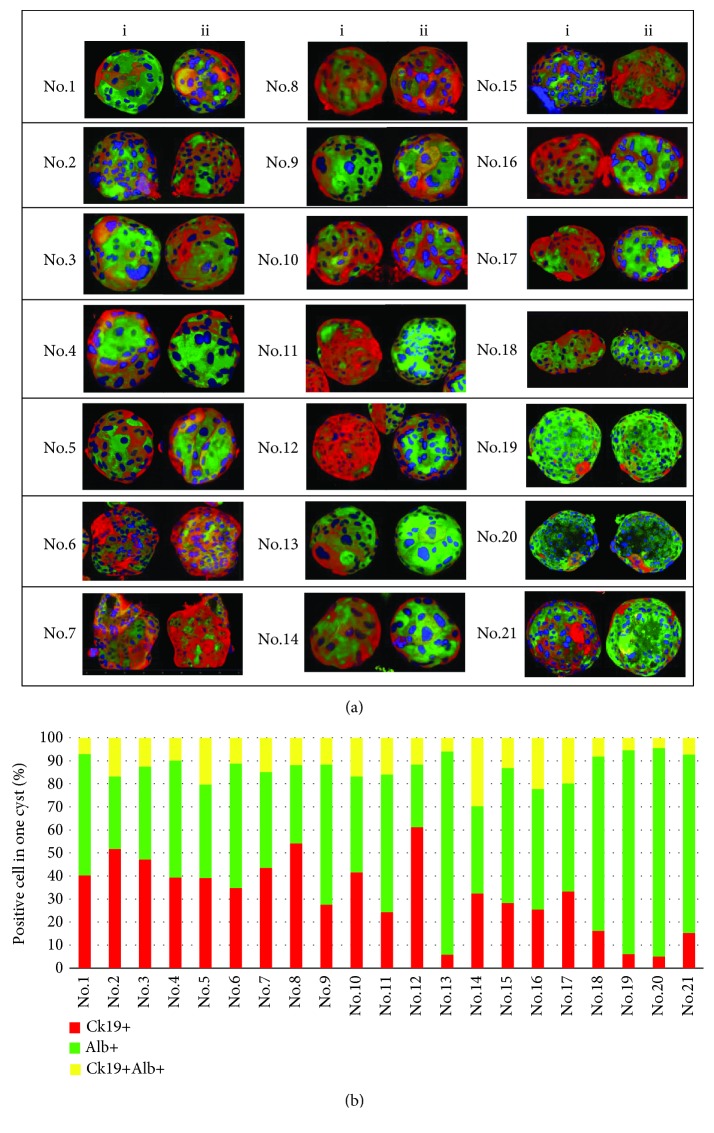
Figure 3.
Distributions of hepatocytes and cholangiocytes in 3D cysts (see also ). (a) Confocal microscopy images of 21 cysts stained with antibodies against Ck19 and Alb; single cyst was split into two spheroids; (i) and (ii) represent superior and inferior spheroids, respectively. (b) Percentages of Ck19+ (red), Alb+ (green), and Ck19+Alb+ (yellow) cells in 21 cysts.

