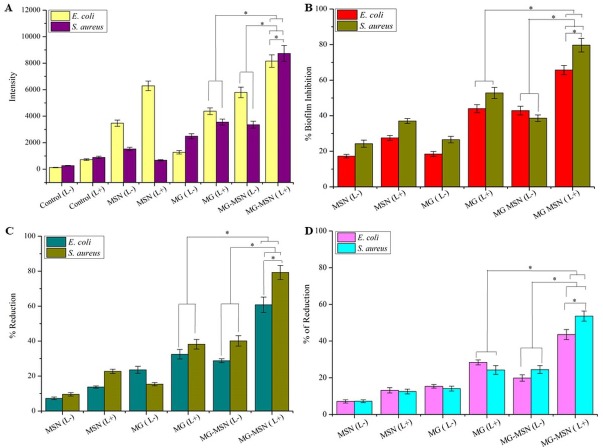
Figure 6. The bar graphs were representing effect of aPDT on test bacteria in their biological activity; (A) ROS generation, (B) biofilm inhibition, (C) reduction in cellular viability (D) percentage reduction on EPS formation of E. coli and S. aureus by aPDT treatment using MSN, MG and MG-MSN, respectively.
Error bars represent the standard deviation and * Represents the significance level at p < 0.05.

