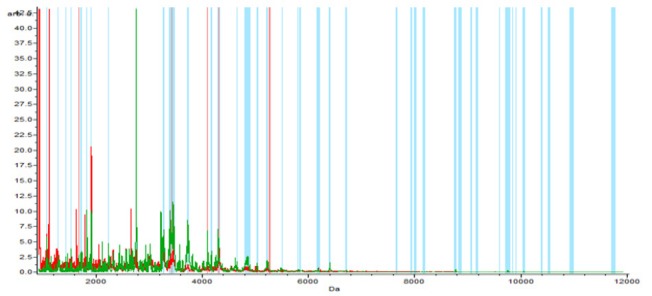
Figure 2-B.
The Pseudogel View Using C8 in ClinPro Tools. The figure shows class I (benign) at the bottom and class II (controls) in the top. Each peak is represented by a vertical line. The difference in intensity between the lines in class I and class II represents the differential peak expression between the two classes

