
Figure 2.
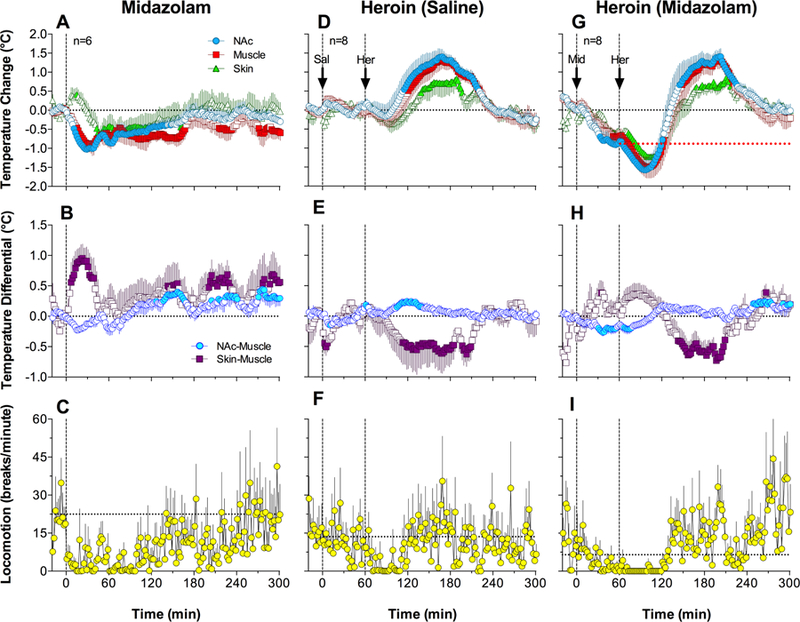
Mean (±SEM) changes in temperature, temperature differentials, and locomotion induced by iv administration of midazolam (A-C) and heroin injected one hour after saline (D-F) or midazolam pretreatment (G-I). Filled symbols indicate values significantly different from pre-injection baseline (time=0), shown as black horizontal dotted lines. Vertical black lines indicate the moment of injection. Red dotted line (G) shows the pre-heroin baseline established after midazolam injection. Horizontal dotted lines in the locomotion graphs show mean locomotion for 10 min preceding drug injection.