
Figure 4.
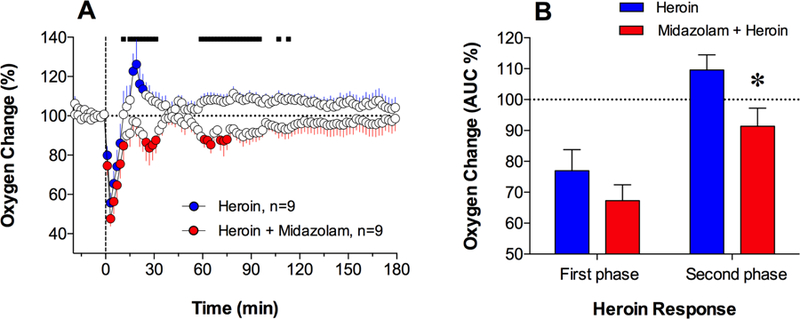
Mean (±SEM) changes in NAc oxygen levels (in percent vs. pre-injection baseline=100%) induced by iv administration of heroin and its co-administration with midazolam (A). Filled symbols indicate values significantly different from the pre-injection baseline and the bold horizontal line shows significant between-treatment differences. C shows differences in the initial oxygen decreases (0–12 min) and subsequent increases (12–40 min) induced by heroin in the two treatment groups. These data were calculated as mean (±SEM) area under the curve in each treatment group and compared using Student’s t-test. Asterisk shows significant between-treatment differences assessed in the areas under the curves (p<0.05).