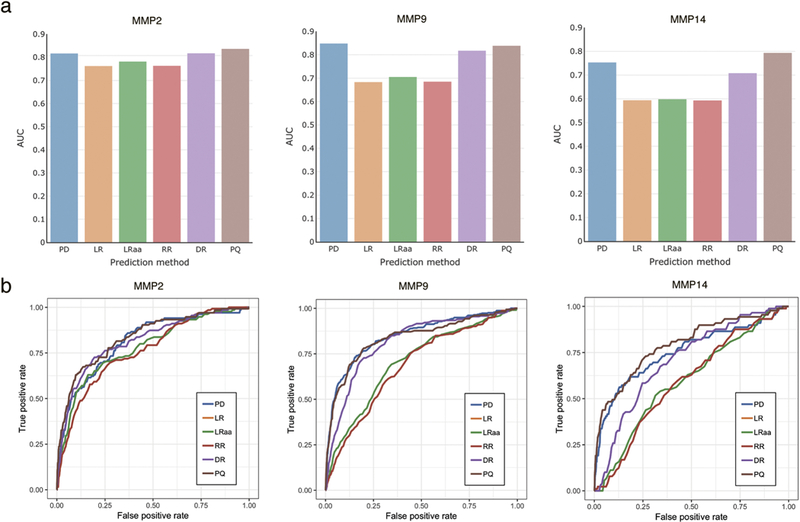
Figure 3.

(a) Comparison of the prediction quality of the considered regression methods by ROC curves on CutDB proteolytic events. (b) Area Under ROC Curves (AUC) calculated for the considered regression methods on the CutDB data. Abbreviations: PD – phage-display derived PWM, LR – linear regression, LRaa – linear regression with grouping of rare amino acids, RR – ridge regression, DR - regression with amino acid parametrization, PQ – regression with random peptides.
