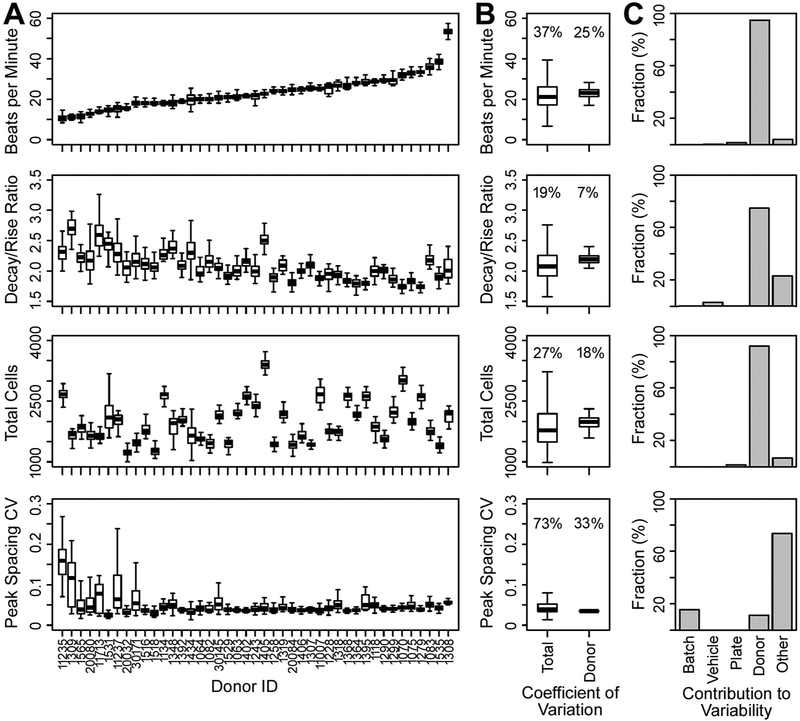
Fig. 4.
iPSC-derived cardiomyocytes exhibit cell line (i.e., inter-individual) variability in baseline beating parameters, largely driven by donor. (A) Boxplots showing baseline values for the phenotypes beats per minute, decay/rise ratio, total cells, and peak spacing CV for each donor, ordered by increasing baseline peak frequency (beats per minute). Boxplots for each donor are comprised of the median, interquartile range (IQR), and 95% confidence interval (CI) values. (B) Boxplots showing the distribution of the coefficient of variation for total and donor contributions to the total variability of each phenotype, based on robust linear mixed effects modeling. Total contribution accounts for technical and biological (i.e., donor) sources of variability, whereas donor variability accounts only for biological variability. (C) Histograms showing the fraction of technical (batch, plate, vehicle, other) and biological (donor) contributions to the total variability of each phenotype, based on robust linear mixed effects modeling. Sources of variability considered account for batch (screening batch dates) effects, plate (inter-plate) effects, vehicle (0.5% DMSO vehicle vs. cell culture media) effects, donor (biological) effects, and other residual contributions.

