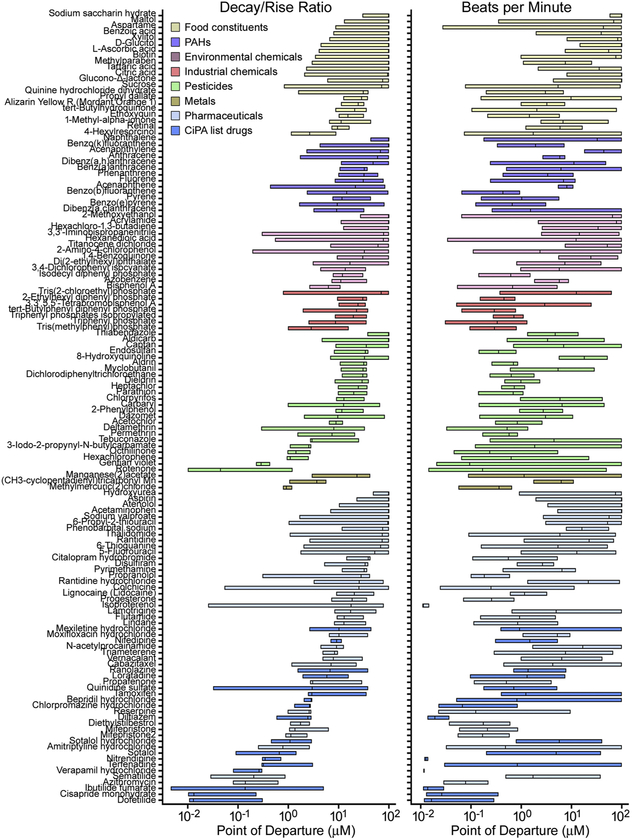
Fig. 5.
Chemical-specific variability in potency and degree of population variability for decay/rise ratio and beats per minute. Box plots show median and inter-quartile range of the point of departure values across 43 donors, sorted within chemical class. Chemical names are along with left axis, and different colored boxes represent chemical classes as shown in the inset.

