Fig. 8.
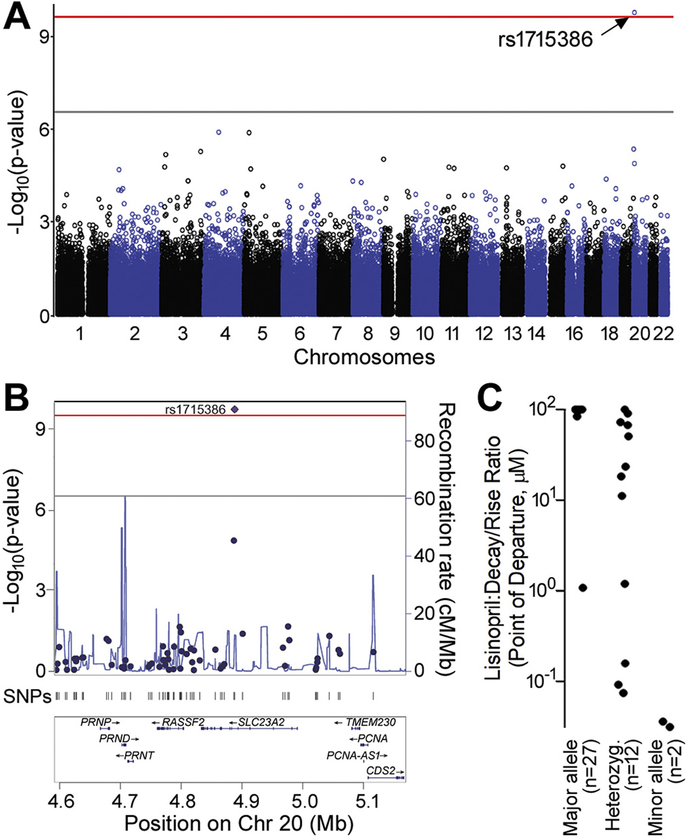
Genome-wide association analysis. (A) Manhattan plot showing all analyzed SNPs and highlighting rs1715386 in SLC23A2 for associations with point of departure in the decay:rise ratio after treatment with lisinopril (adjusted for ancestry and sex) with minimum p = 2.26e-10. The grey line represents the −log10(p-value) = 0.05 significance threshold applied for a single tested phenotype. The red line represents the −log10(p-value) = 0.05 significance threshold for all ~220 million SNP × phenotype tests. (B) A locus zoom plot of the 500 kb region surrounding rs1715386 on chromosome 20. (C) Distribution of the decay/rise ratio POD of 41 iPSC lines treated with lisinopril. X-axis values for points have been slightly jittered in order to be distinguished. (For interpretation of the references to colour in this figure legend, the reader is referred to the web version of this article.)

