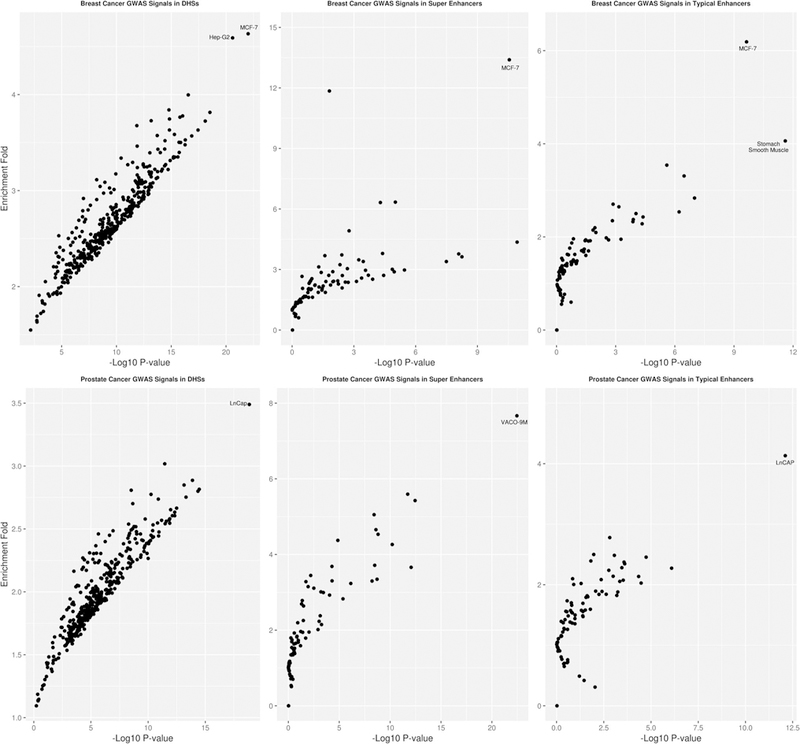
Fig. 2.

Enrichment of GWAS significant signals with p value < 10−8 of breast (upper panel) and prostate cancer (lower panel) in DHS (left panel), super enhancer (middle panel), and typical enhancer regions (right panel). Each observation in the plot corresponds to an annotation type
