
Fig. 4.
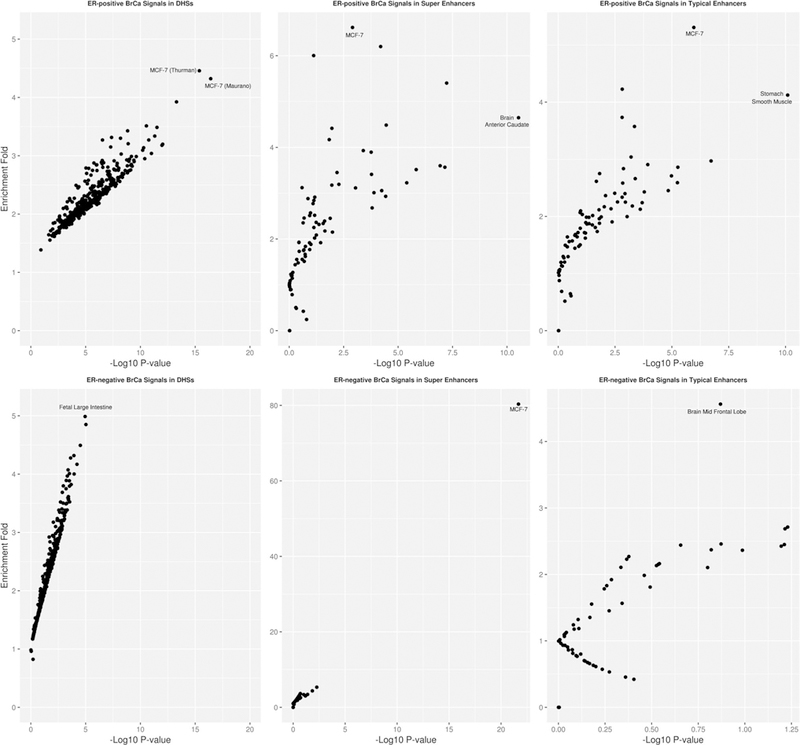
Enrichment of GWAS significant signals with p value < 10−8 of ER-positive (upper panel) and ER-negative (lower panel) breast cancer in DHS (left panel), super enhancer (middle panel), and typical enhancer regions (right panel). Each observation in the plot corresponds to an annotation type