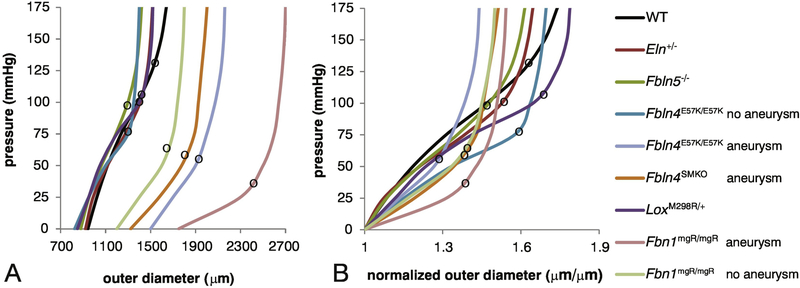
Figure 2. Pressure-diameter curves for ascending aorta from adult mice with elastic fiber defects.
Absolute values of the outer diameter at each pressure (A) and normalized values with respect to the starting outer diameter at 0 mmHg (B) are shown. The local slope of the curve represents the structural stiffness. The black circles on each curve mark the approximate transition from low stiffness (elastin dominated) to high stiffness (collagen dominated) behavior. Aortas from mice with elastic fiber defects transition to high stiffness at lower pressures than wild-type, with aneurysmal models having the lowest transition pressure. Data was approximated from [55] for Eln+/−, [61] for Fbln5−/−, [65] for Fbln4E57K/E57K, [66] for Fbln4SMKO, [73] for Lox+/M298R, and [78] for Fbn1mgR/mgR. The wild-type (WT) curve was estimated from the average behavior of three different studies[55, 61, 66].

