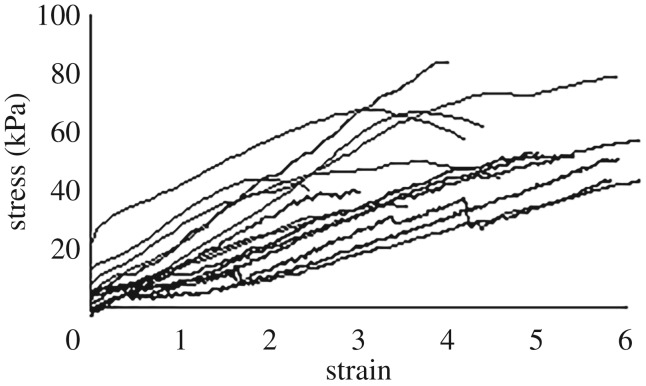
Figure 3.
The linear regions of stress–strain curves for slug glue. Data is shown up to the point where the sample yielded visibly. Strain rate ranged from 0.01 to 0.7 s−1. The data was smoothed using a running average such that each point represents an average of a set of points comprising roughly 0.5 to 1% of the total data.

