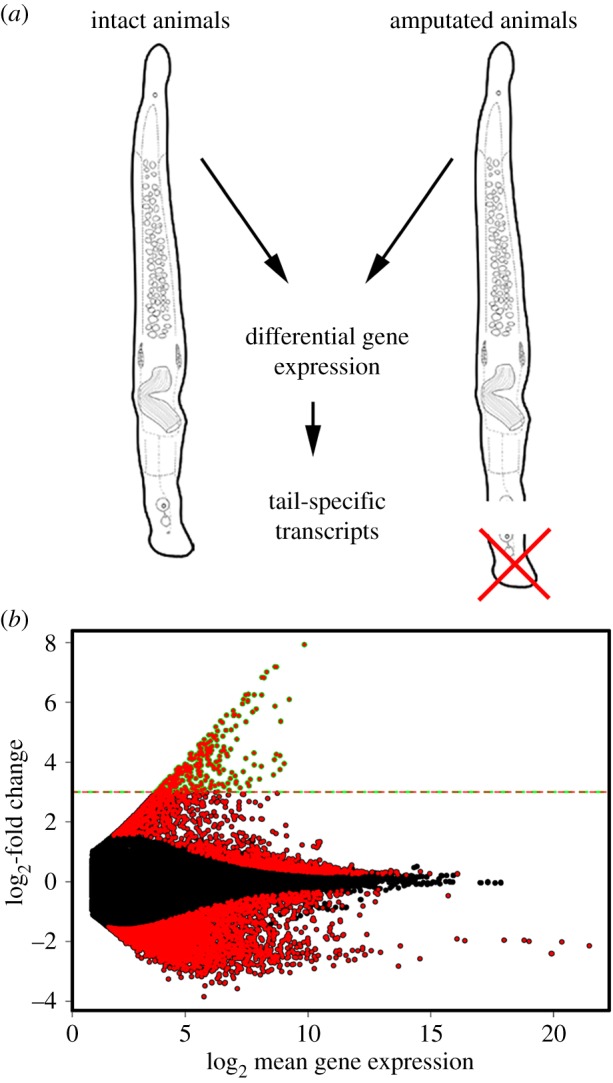
Figure 2.

Transcriptome and differential gene expression. (a) Illustration of the strategy of the differential gene expression approach. (b) Differentially expressed transcripts with an adjusted p-value < 0.01 are indicated in red. Transcripts with an eightfold expression or higher (dashed line) were considered for further analyses.
