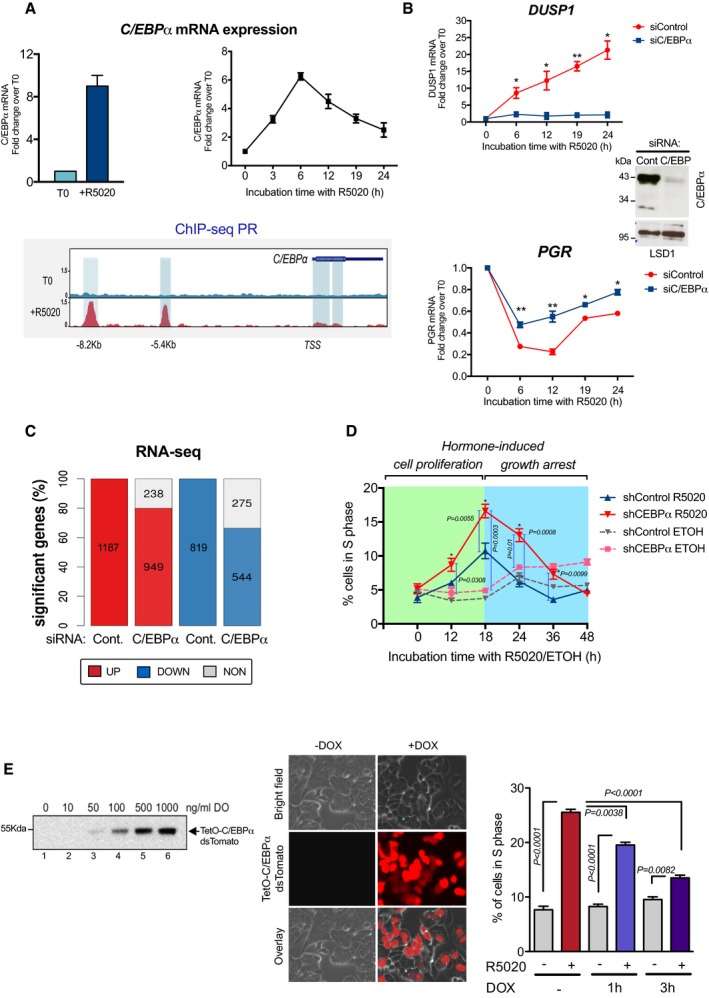
Figure 1. In breast cancer cells, C/EBPα is a hormone‐target gene and modulates hormonal gene regulation and cell proliferation.

- Top left panel: Hormone‐induced fold change in the expression of mRNA for C/EBPα in T47D cells exposed to vehicle (T0) or to progestin (10 nM R5020) for 6 h (+R5020). The fold change relative to T0 is expressed as mean ± SD from three experiments performed in duplicate. Top right panel: Time kinetics of C/EBPα mRNA expression after hormone induction in T47D cells. The fold change relative to T0 is expressed as mean ± SD from three experiments performed in duplicate. Lower panel: Snapshot of the genome browser showing the profile of PR ChIP‐seq at T0 and after 60 min of hormone exposure (+R5020) around the C/EBPα gene shown in the upper right corner. The direction of transcription indicated.
- T47D cells transfected with control or C/EBPα siRNAs were treated with 10 nM R5020 for the indicated time periods; cDNA was generated and used as template for real‐time PCR with DUSP1 (upper panel)‐specific and PGR (lower panel)‐specific primers. The values are given as mean ± SD from three experiments performed in duplicate. The inset shows the level of C/EBPα depletion by Western blot, using LSD1 as loading control. P‐values were obtained by Student's t‐test and are relative to time zero (*P ≤ 0.05 and **P ≤ 0.01)
- Effect of C/EBPα knockdown on global hormonal gene regulation. T47D cells transfected with control or C/EBPα siRNAs were incubated with 10 nM R5020 for 6 h, and RNA‐seq experiments were performed as described in the Materials and Methods. The number of significant (q < 0.01) differentially expressed genes upon exposure to hormone identified in each of the siControl and siC/EBPα systems is shown. Differential expression analysis between treated and control conditions was done with R (https://www.R-project.org/) package DESeq2 (Love et al, 2014), selecting as significant those genes with an adj. P < 0.01 and a fold change > 2 between conditions.
- Effect of C/EBPα depletion in T47D cells on hormone‐induced entry in S phase. Cells were treated with Ethanol or R5020 for different time periods and subjected to flow cytometric analysis. Data are represented as mean ± SD from three experiments performed in duplicate. The P‐values were obtained using ANOVA followed by Tukey test.
- Left panel: Levels of C/EBPα expression in cells transfected with a Dox‐inducible TetO‐C/EBPα vector (T47DindC/EBPα) incubated with different concentrations of doxycycline, as detected by Western blot. Middle panel: T47DindC/EBPα were induced with doxycycline (1 μg/ml Dox) for 16 h and the expression of C/EBPα was detected by immune fluorescence microscopy. Right panel: Quantitation of the percentage of T47DindC/EBPα cells entering in S phase upon exposure to Dox (1 μg/ml) for 1 or 3 h followed by hormone induction for 18 h. Data are represented as mean ± SD from three experiments performed in duplicate. The P‐values were obtained using ANOVA followed by Tukey test.
Source data are available online for this figure.
