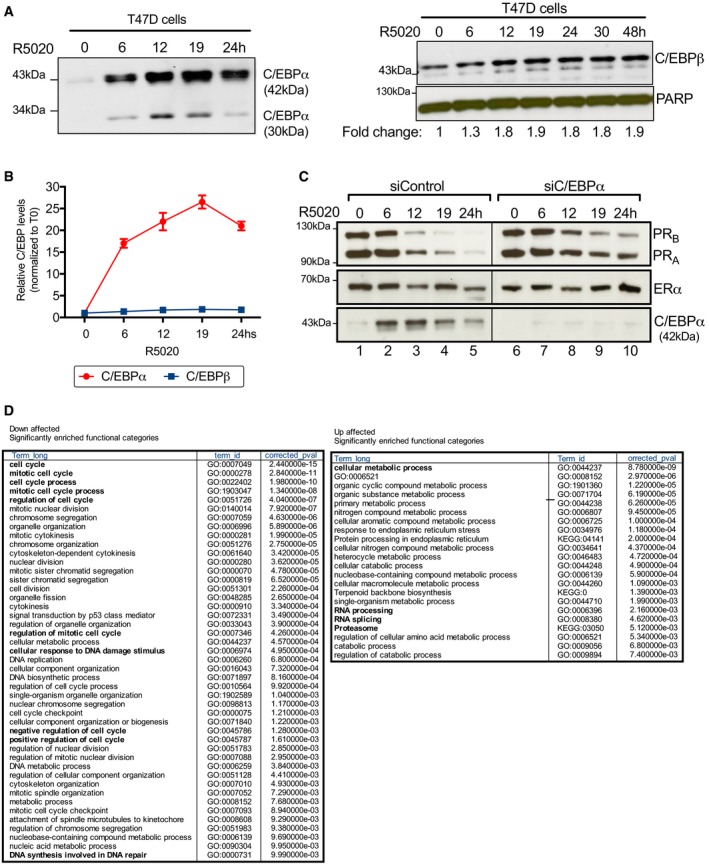
Figure EV1. Hormone induces the expression of C/EBPα in breast cancer cells.

- Time kinetics of C/EBPα expression after hormone induction in T47D cells. T47D cells treated with ethanol or with 10 nM R5020 as indicated were lysed and analyzed by immunoblot with α‐C/EBPα (left panel) or with α‐C/EBPβ (right panel). An antibody to PARP was used as loading control.
- Quantitation of the bands shown in panel (A) using densitometric analysis and ImageJ software. Values were normalized to time zero (T0). Each bar represents the mean ± SD from two experiments.
- T47D cells transfected with control or C/EBPα siRNAs and treated or not with 10 nM R5020 as indicated were lysed and analyzed by immunoblot with specific antibodies for PR, ER, and C/EBPα.
- GO analysis of C/EBPα‐dependent genes in T47D cells. We used g:Profiler (Reimand et al, 2016) to identify Gene Ontology Biological Process (GO:BP) in the differentially expressed genes.
Source data are available online for this figure.
