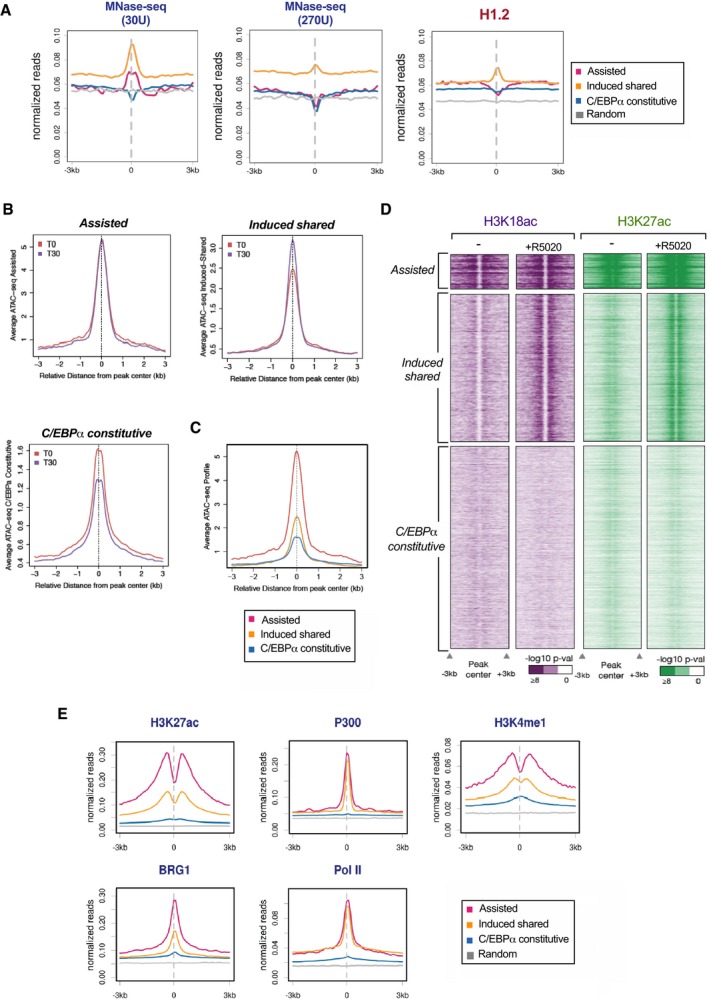
Figure 4. “Assisted” and “Induced shared” regions exhibit characteristics of active enhancers.

- Nucleosomes occupancy in the different clusters was analyzed using MNase‐seq in untreated T47D cells at 30 and 270 units of MNase as indicated (left panels). ChIP‐seq using H1.2‐specific antibody was performed in untreated T47D cells (right panel). Average profiles of the reads for each group are shown.
- Sitepro (CEAS package) analysis was employed to plot average ATAC‐seq for each cluster of Fig 3C. The average ATAC‐seq values before and after hormone exposure (+R5020) were plotted within a window of ± 3 kb of the C/EBPα peaks.
- Sitepro (CEAS package) analysis was employed to plot average ATAC‐seq for each cluster at time T0 within the same y axis.
- Heat map showing the enrichment (−logP) of H3K18ac and H3K27ac for each cluster of Fig 3C. Increasing color shades represent enrichment as calculated above(see scales under the heat maps).
- Behavior of enhancer marks around C/EBPα peaks as detected using ChIP‐seq experiments with specific antibodies to H3K27ac, H3K4me1, P300, BRG1, and RNA Pol II, in untreated and in cells exposed to hormone. Average profiles of the reads for each group are shown.
