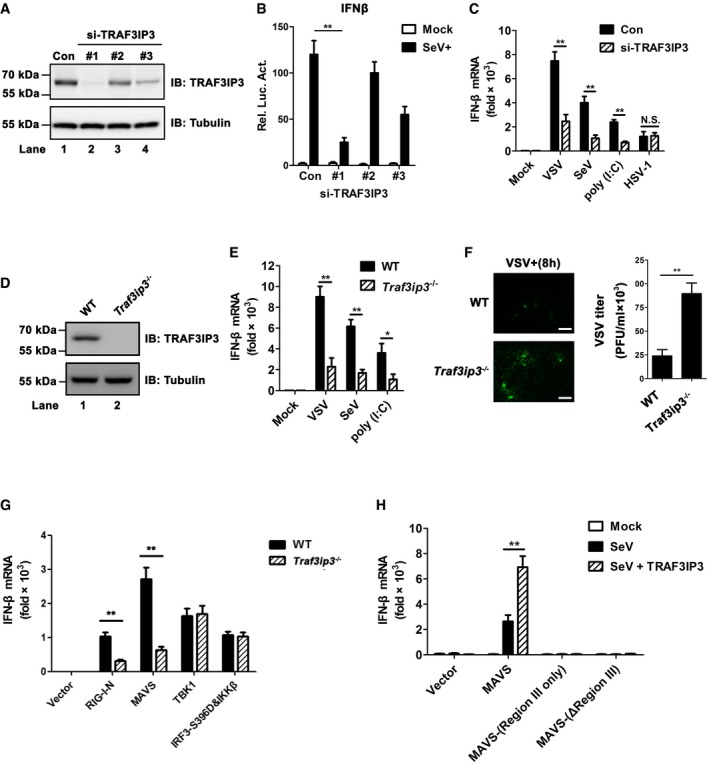
Figure 2. TRAF3IP3 regulates interferon production in response to RNA virus infection.

- Three pairs of small interfering RNA against TRAF3IP3 were transfected into HEK293T cells, respectively, and immunoblotting was then employed to examine the knockdown efficiency. A pair of scrambled RNA oligos was transfected and signified as con.
- Three pairs of si‐TRAF3IP3 together with IFNβ‐luciferase reporter were transfected into HEK 293T cells. Twenty‐four hours after transfection, the cells were infected with (SeV) or without (mock) Sendai virus, which were harvested 6 h post‐infection to measure the luciferase activity.
- Si‐TRAF3IP3 (oligo #1) was transfected into HEK 293 cells, which were then treated with mock, VSV, SeV, poly(I:C), or HSV‐1. After various treatments, IFNB inductions were measured by qPCR.
- Immunoblotting to detect TRAF3IP3 in wild‐type and Traf3ip3 −/− HEK293T cells.
- Wild‐type and Traf3ip3 −/− HEK293T cells were treated with or without VSV, SeV, or poly (I:C) as indicated for 12 h. IFNB induction was measured by qPCR.
- Wild‐type and Traf3ip3 −/− HEK293T cells were infected with GFP‐VSV. Fluorescent images were taken to examine GFP‐VSV proliferation at 8 h post‐infection (left). Scale bar represents 10 micrometers. GFP‐VSV titers were quantitated by plaque assay (right).
- Various expression constructs were transfected into WT and Traf3ip3 −/− HEK293T cells. Thirty‐six hours after transfection, IFNB induction was measured by qPCR. Protein expression levels are shown in Fig EV2A.
- Mavs −/− HEK293T cells were transfected with empty vector, pcDNA‐FLAG‐MAVS, pcDNA‐FLAG‐MAVS‐(Region III only), or pcDNA‐FLAG‐MAVS‐(ΔRegion III), together with pcDNA3‐FLAG‐TRAF3IP3 or not as indicated. Twenty‐four hours after transfection, cells were infected with SeV for 12 h. IFNB induction was measured by qPCR. Protein expression levels are shown in Fig EV2B.
