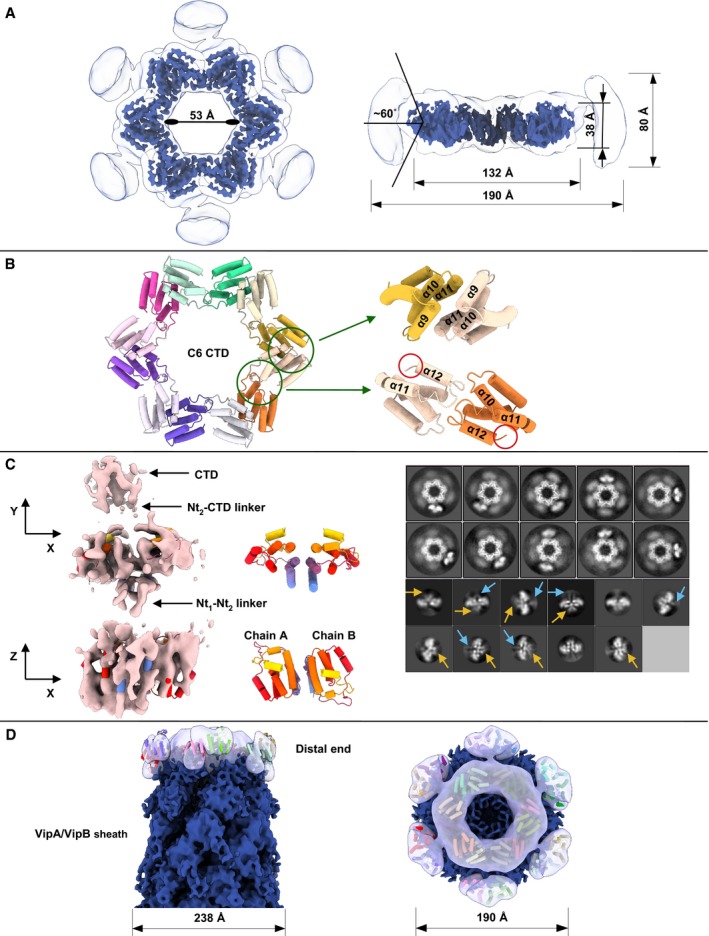
Figure 3. Cryo‐EM of TssAVC .

- Top view and side cutaway view of the TssAVC cryo‐EM reconstruction, shown low‐pass filtered at a lower (white, transparent) and higher (royal blue, non‐transparent) threshold. Possible (−60°; 60°) range of motion of Nt2 domain relative to the CTD ring plane is shown.
- Top view of the ribbon diagram of TssAVC CTD model. Two interfaces are highlighted with green circles. Enlarged side view of interface between helices α9–α11 of two neighboring subunits (top right), enlarged side view of interface between α11–α12 linker of one subunit and helix α10 from the neighboring subunit based on conserved WEP motif (bottom right). Part of Nt2‐CTD linkers are highlighted with red circles.
- Top view (XY‐plane) and side view (XZ‐plane) of the TssAVC Nt2 domain cryo‐EM reconstruction (pink, non‐transparent) shown with fitted Nt2‐dimer model (left). Partial Nt2‐CTD and Nt1‐Nt2 linker densities are highlighted with black arrows. Top and side views of ribbon diagram of Nt2 dimer (middle). Representative 2D class averages of TssAVC particles with visible connections between Nt2 dimer and CTD (top right), representative 2D class averages of Nt2‐dimer particles, Nt2‐CTD linker and Nt1‐Nt2 linker densities are highlighted with blue and yellow arrows (bottom right).
- Side and top views of putative model of TssAVC Nt2‐CTD ring fitted into cryo‐EM reconstruction (royal blue, non‐transparent) of the distal end of TssAVC T6SS (EMD‐3878). TssAVC Nt2‐CTD symmetrized reconstruction shown (white, transparent), fitted Nt2‐CTD model shown as a ribbon diagram.
