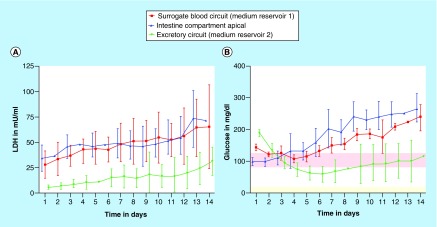
Figure 2. . Systemic tissue viability in the four-organ-chip over 14 days of coculture.
Measured by LDH activity (A) and glucose balance (B). Means with standard deviation are plotted. n = 10. The physiological glucose concentration range in the human blood [38] (red area) and urine [39] (light yellow area) of healthy people is drawn for comparison.

