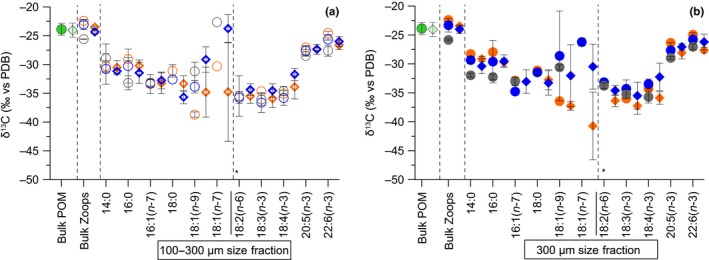
Figure 3.

δ13C values (mean ± SD) of bulk in particulate organic matter (POM) and two mesozooplankton size fractions ((a) 100–300 µm; (b) ≥300 µm), and in individual fatty acids (in ‰ vs. PDB) only in mesozooplankton from the surface water (orange symbols), the winter water (blue symbols), and the bottom water (gray symbols) at the Eastern Gotland Basin in July 2014 (circles) and 2015 (diamonds). Notes: Error bars are standard deviations over a 24‐hr sampling period of mesozooplankton (n = 2–4 from the particular depth of each size fraction). POM was pooled from different depths (from 10 m to max. 100 m, bright green, n = 6) in 2014, and from the SW and the WW (from 1 m to max. 30 m, pale green, pooled sample, n = 8) in 2015. (*)—Separation between nonessential (left) and essential (right) component
