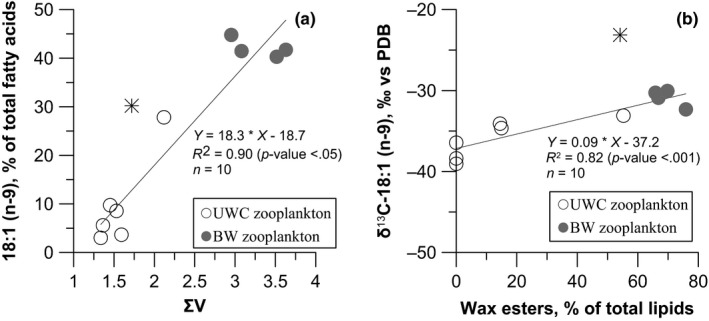
Figure 5.

(a) The fatty acid 18:1 (n‐9) content (% of total fatty acids) of mesozooplankton size fractions relative to microbial degradation index (Σ) results from Eglite et al. (2018). (b) The δ13C values of fatty acid 18:1 (n‐9) relative to the wax ester content (% of total lipids). The statistics for the respective regression are included in the figures. Notes: The linear regression analysis was used to quantify the relationship between the upper water column (UWC, open circles) and the bottom water (BW, gray circles) mesozooplankton communities. One data point (from the UWC in 2014 at 23:15 hr, a mixing point with Pseudo‐/Paracalanus spp. community, Appendix S1: Table S1) was excluded from both regression analyses
