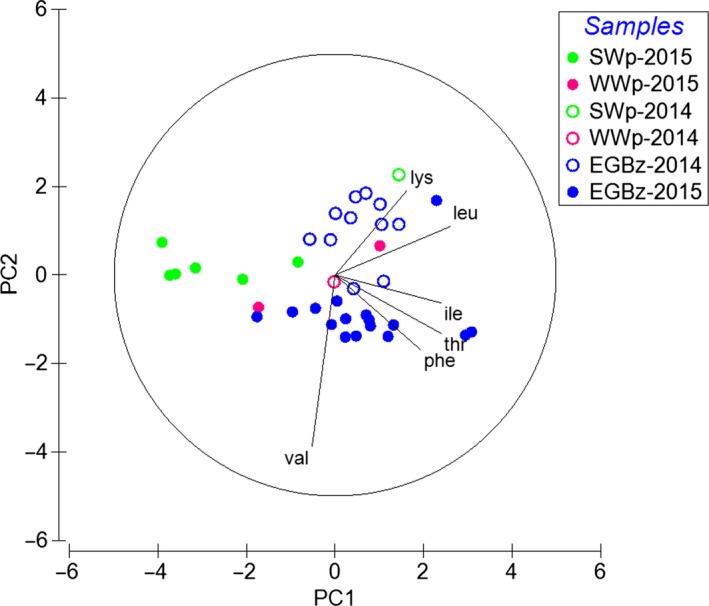
Figure 6.

The principal component analysis of δ13C values in essential amino acids of particulate organic matter from the surface water (SWp, green circles) and the winter water (WWp, pink circles) together with mesozooplankton of the overall water column (0–max. 125 m) at the Eastern Gotland Basin (EGBz, blue circles) from two summers in July 2014 (open symbols) and 2015 (filled symbols). Notes: Together, the two leading principal components (PCs) explained 67.8% of the variability, with PC1 and PC2 accounting for 47.7% and 20.7% of the variability by each axis, respectively. The amino acids are indicated by their three‐letter amino acid code as explained in the text
