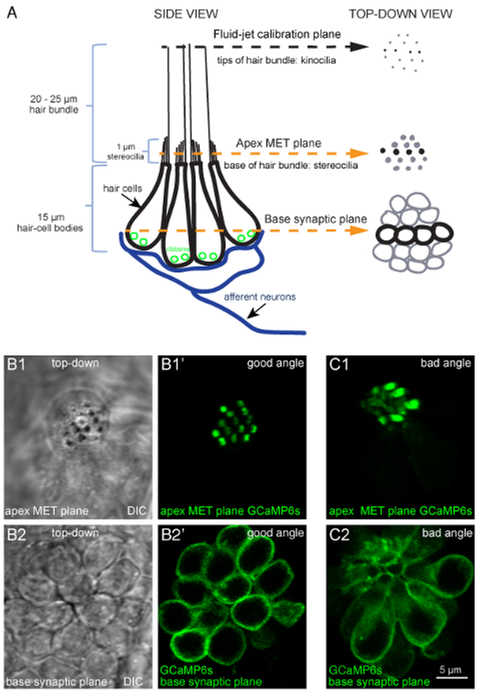
Figure 1: Overview of a lateral-line neuromast and functional imaging planes.
(A) The diagram to the left depicts a side-view of a neuromast with four hair-cell bodies (black) contacting postsynaptic afferent neurons (blue). Ribbons (green) tether vesicles at presynaptic active sites within each cell. Apical to each cell body is a bundle of stereocilia (1 μm) that contain MET channels. Each hair bundle has one kinocilium that transfers the mechanical force of water motion to the base of the hair bundle. The diagram on the right depicts the same model in a top-down view. In this top-down view, black is used to indicate the four cells depicted in the diagram on the left, and gray is used to indicate other cells in the neuromast. Within this model and these 2 views, three important planes are highlighted: (1) the tips of the hair bundles (kinocilia) used to quantify the magnitude of hair-bundle deflection, (2) the apical MET plane at the base of the hair bundles where calcium enters the cell during stimulation, and (3) the synaptic plane at the base of the cell where calcium enters near synaptic ribbons. (B1–B1′) DIC and GCaMP6s top-down images of MET plane at the base of the hair bundles, where mechanosensation-dependent calcium signals can be recorded. (B2–B2′) DIC and GCaMP6s top-down images from the same neuromast as B1–B1′, but at the base of the neuromast in the synaptic plane, where presynaptic calcium signals can be detected. (C1–C2) Images of a neuromast expressing GCaMP6s where the larvae is improperly mounted. In this example, the apical MET plane (C1) and synaptic plane (C2) at the base of the cell are positioned at a suboptimal angle. This position does not allow for all hair bundles to be imaged in a single plane, and many more imaging planes are needed to capture activity at all synapses within this neuromast compared to B1–B2′. Images are of larvae at 5 dpf. The scale bar in C2 corresponds to all images in B1–C2.

