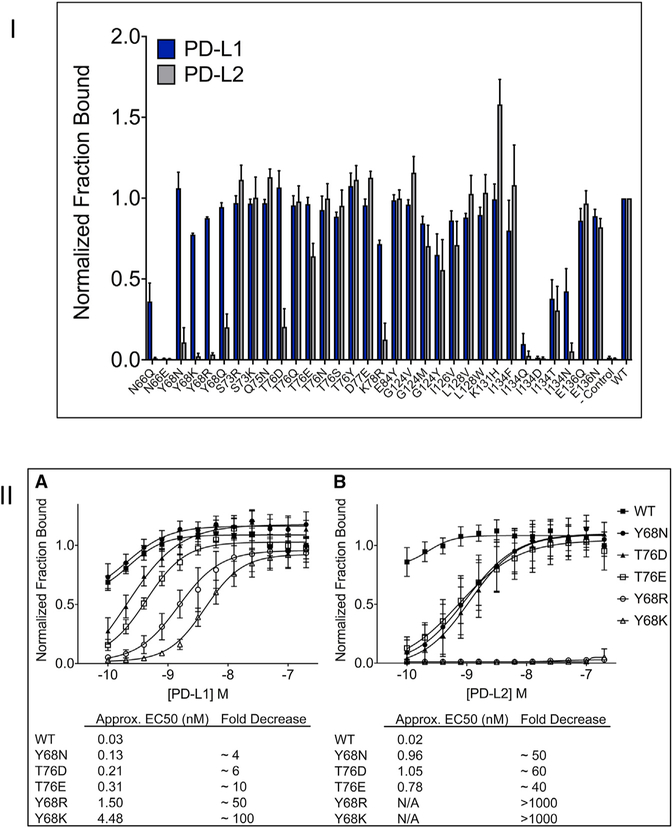
Figure 3. Experimental Testing of Selectivity of PD-1 Mutants.
(I) Flow cytometric analysis of hPD-1 mutants binding to PD-L1 and PD-L2. The data represent the average of three independent experiments with error bars showing the standard deviation. (II) Titration of hPD-1 mutants show s selective binding to PD-L1.
(II) (A) HEK293 suspension cells transiently expressing WT or mutant PD-1 were challenged with increasing concentrations of hPD-L1 hIgG1 (0.1–200 nM) and fluorescence-activated cell sorting analysis was used to determine the percent of PD-1 expressing cells (mCherry) bound to PD-L1. For each experiment, the titration data were normalized to WT PD-1 binding to the highest concentration of PD-L1. Data shown represents four independent experiments with SD. (B) The same analysis as shown in (A) except titrating hPD-L2 hIgG1 protein. Half maximal effective concentration (EC50) values could not be estimated for Y68R and Y68K (N/A) as no detectable binding was observed within the range of concentrations analyzed.

