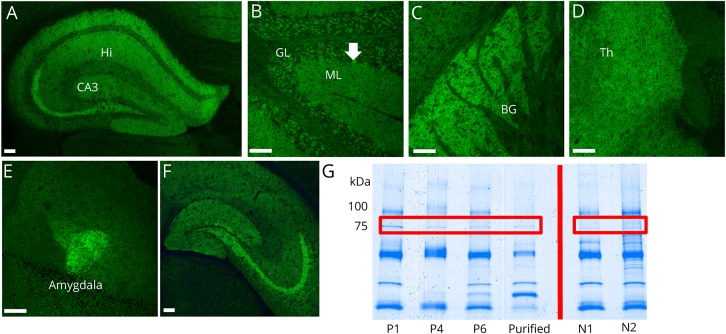
Figure 1. The distribution of neurochondrin immunoreactivity in mouse brain tissue revealed by binding of patient IgG.
(A–F) Patient serum IgG yields a synaptic-type immunofluorescence pattern in (A) hippocampus (Hi) CA3 layer and pyramidal cells, (B) cerebellar cortex, molecular layer (ML) more than granular layer (GL), and perikarya of Purkinje neurons (arrow), (C) basal ganglia (BG), (D) thalamus (Th), and (E) amygdalar neurons. (F) IgG purified from patient serum by adsorption to (and elution from) 75 kDa Western blot band recapitulates this staining pattern (hippocampus shown). (G) Coomassie staining of mouse cerebral protein extract immunoprecipitated with serum from patients 1, 4, and 6; purified IgG (from patient 1 and 4) and control serums (N1 and N2). Patient serum, but not healthy control serum, immunoprecipitated a protein of approximately 75 kDa. Scale bar = 100 μm. IgG = immunoglobulin G; kDa = kilodalton.

