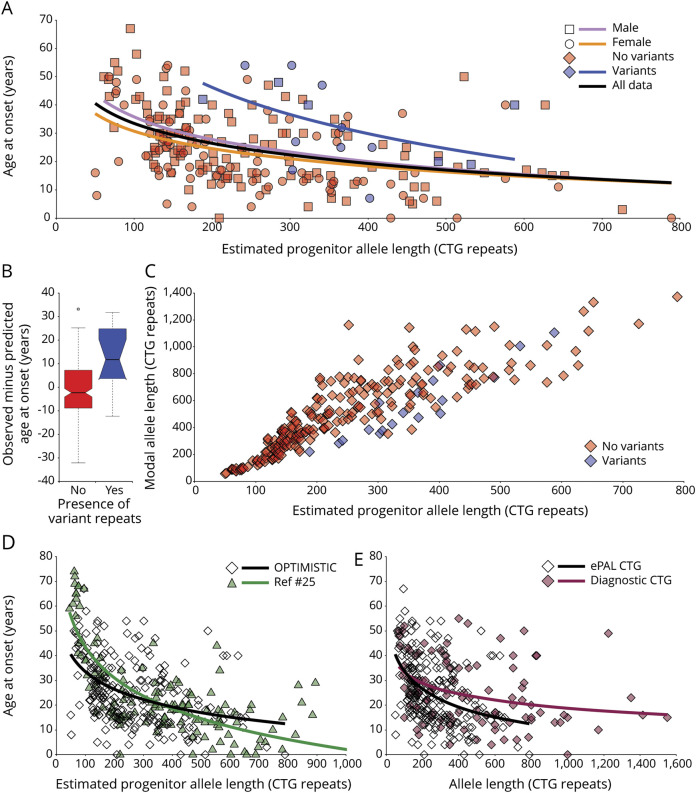
Figure 2. Age at onset and somatic instability correlations.
(A) Age at onset is highly correlated with estimated progenitor allele length (ePAL). The scatterplots show the relationship between ePAL and age at onset. The relevant line of best fit under a logarithmic model for female individuals (circles, orange line), male individuals (squares, lavender line), and sex-averaged for all individuals (black line, model 1a) (table 1) are shown. Individuals with (blue) and without (red) AciI-sensitive variant repeats are also depicted, along with the logarithmic regression line for AciI-sensitive variant repeat carriers (blue line). (B) Effect of variant repeats on age at onset. Shown are boxplots for the difference in observed age at onset minus predicted age at onset for Observational Prolonged Trial in Myotonic Dystrophy Type 1 to Improve Quality of Life—Standards, a Target Identification Collaboration (OPTIMISTIC) participants with (yes, blue) and without (no, red) AciI-sensitive variant repeats in their expanded DMPK allele. Predicted age at onset was derived using model 1a (Ageo = 80.3 + [−23.4 × log(ePAL)]) (table 1). The mean difference in age at onset for participants carrying AciI-sensitive variant repeats was 13.2 years (95% confidence interval [CI] 5.7 to 20.7, 2-tailed t test t = −3.7, p = 0.0019). The bottom and top of the box are the lower and upper quartiles, respectively. The band near the middle of the box is the median and the notches approximate to the 95% CI for the medians. The whiskers represent the full range of observations bounded by an upper limit equal to the upper quartile plus 1.5× the interquartile range, and a lower limit equal to the lower quartile minus 1.5× the interquartile range. Any points outside these bounds are displayed individually as small circles. (C) Modal allele length, ePAL, and presence of AciI variant repeats. The scatterplots show the relationship between ePAL and modal allele length at the V2 time point. Individuals with (blue) and without (red) AciI-sensitive variant repeats are indicated. (D) Sampling bias in the OPTIMISTIC cohort. The scatterplots show the relationship between ePAL and age at onset for the OPTIMISTIC cohort (open diamonds, black line) and a family-based DM1 population characterized by Morales et al.25 (green triangles and line). The relevant line of best fit under a logarithmic model (model 1a, table 1) is shown for each population (for the OPTIMISTIC cohort n = 222, r2 = 0.178, p = 3.1 × 10⁻¹¹ and for Morales et al., n = 137, r2 = 0.640, p < 2.2 × 10⁻¹⁶). Note that the Morales et al. cohort has more very mildly affected participants with small expansions, and more severely affected patients with large expansions. (E) ePAL is more informative than the diagnostic measure in predicting age at onset. The scatterplots show the relationship between age at onset and ePAL (ePAL, open diamonds and black line) and the diagnostic allele length (diagnostic CTG, maroon diamonds and line) for the OPTIMISTIC cohort. The relevant line of best fit under a logarithmic model (model 1a, table 1) is shown for each CTG measure (for ePAL n = 222, r2 = 0.178, p = 3.1 × 10⁻¹¹ and for diagnostic CTG n = 105, r2 = 0.123, p = 0.00014).

