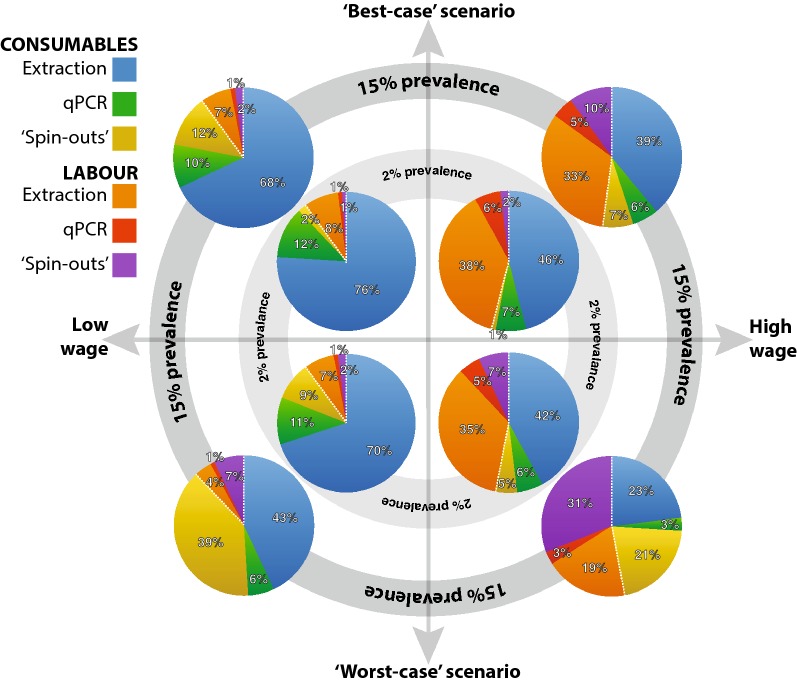
Fig. 4.
Cost analysis on pooling in both low- and high-wage settings in two different scenarios and for two levels of prevalence (2% and 15%) for a single soil-transmitted helminth species. Scenarios represent ‘best’ and ‘worst’ cases of positive sample distributions across 5-sample pools; see main text. Dashed white line separates consumable (extraction, qPCR and ‘spin-out’ reagents) from labour costs

