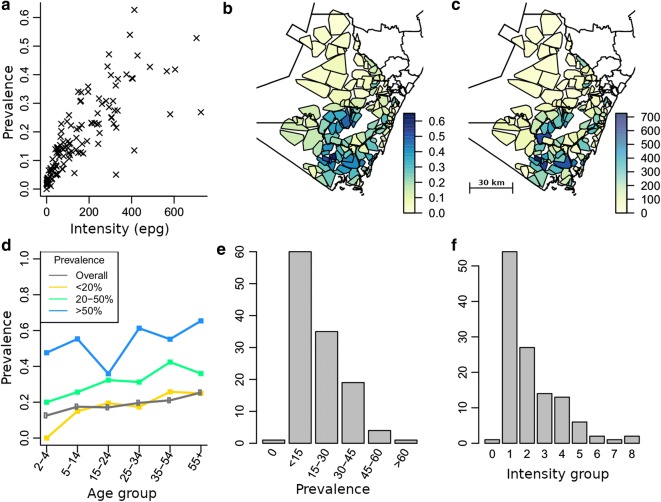
Fig. 1.
Summary statistics of hookworm epidemiological data from TUMIKIA study baseline, Kwale district. a Relationship between mean egg intensity and prevalence by cluster. b and c Regional maps of clusters in Kwale district with associated cluster level prevalence and mean egg intensity, respectively. d The typical age profiles of a cluster from each of the WHO prevalence ranges and the overall prevalence age profile of Kwale district. e and f Histograms of cluster prevalence and mean cluster intensity across all clusters, respectively. Egg intensity classes for panel f: 0, zero epg; 1, 0–100; 2, 100–200; 3, 200–300, etc

