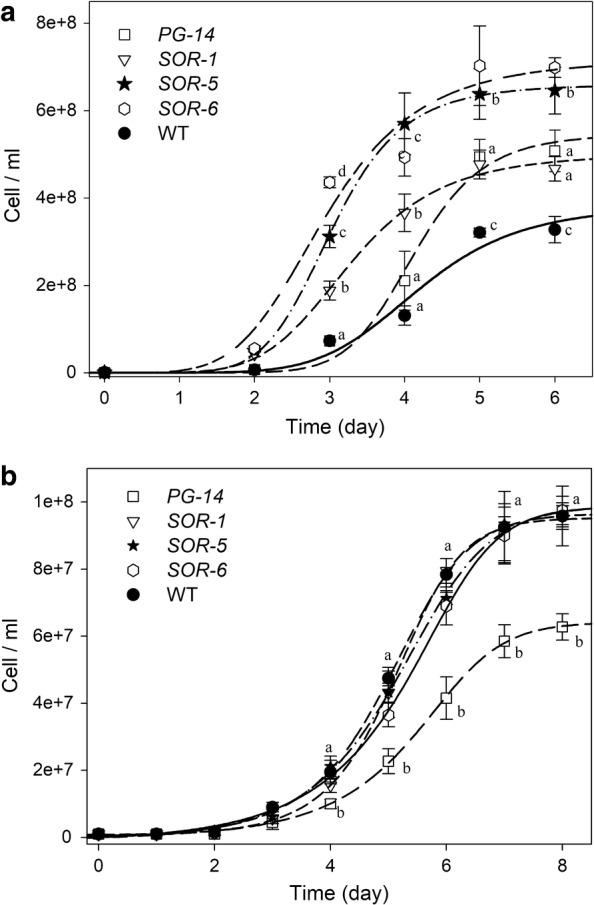
Fig. 6.

Growth curves of WT and mutant strains. Growth of WT, PG-14 and SOR strains was performed under autotrophic conditions, at 25 °C, in 1-L cylinders, illuminated with either 1400 µmol photons m−2 s−1 (panel a) or 50 µmol photons m−2 s−1 (panel b). Cultures were maintained in a semi-batch system fed with air/CO2 mix; CO2 supply was modulated in order to keep the pH of the medium always below 7.2. Symbols and error bars show mean ± SD, n ≥ 6. Values marked with the same letters are not significantly different from each other within the same time point (ANOVA, p < 0.05)
