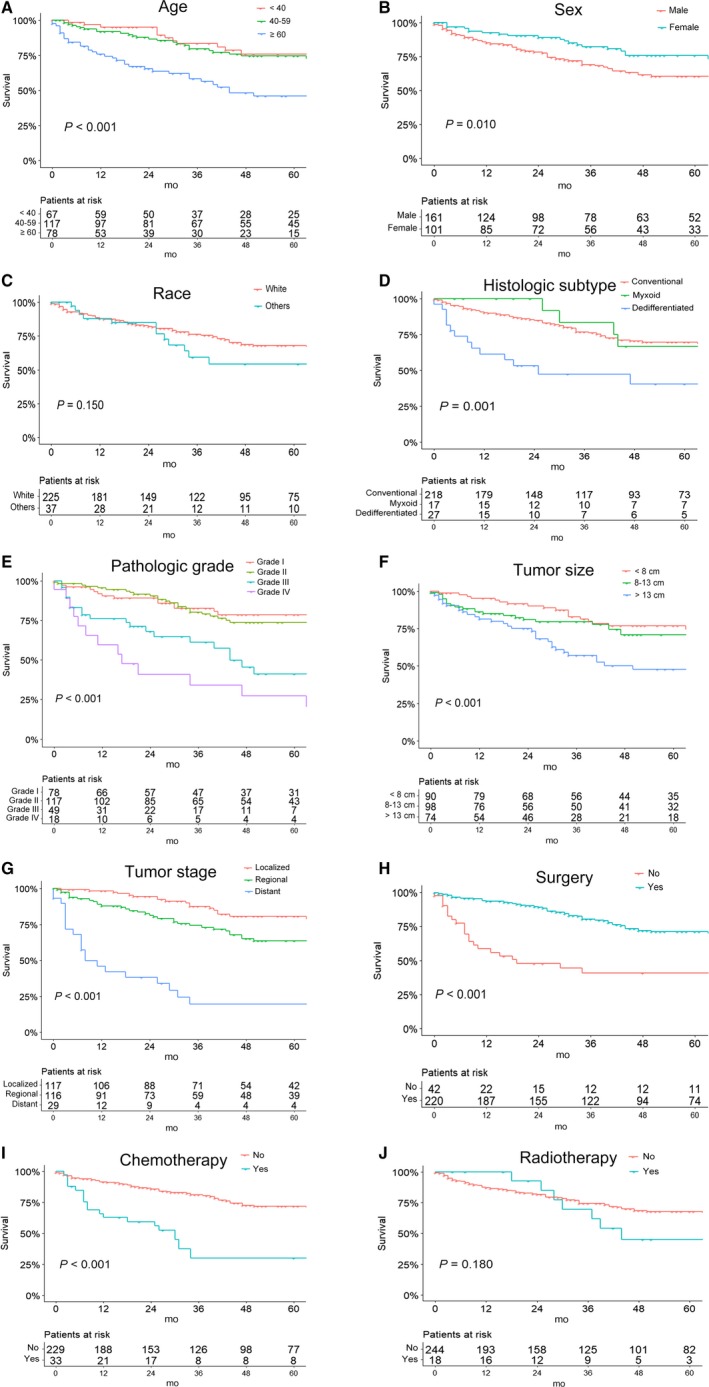
Figure 2.

Kaplan‐Meier curves of overall survival for patients based on (A) age, (B) sex, (C) race, (D) histologic subtype, (E) pathologic grade, (F) tumor size, (G) tumor stage, (H) use of surgery, (I) use of chemotherapy, and (J) use of radiotherapy
