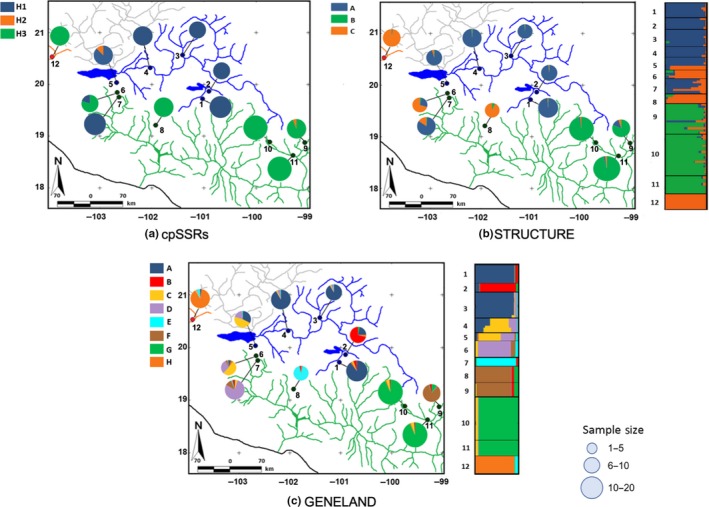
Figure 3.

Geographic structure of genetic variation in one cpSSR and eight nSSR loci in 12 populations of S. humboldtiana. Colored lines indicate sampled basins in this study (green = Balsas; orange = Ameca; blue = Lerma). Gray lines represent the Santiago Basin (part of the Lerma‐Santiago system), but not included in this study. In each panel, colored pay charts represent the genetic composition of the populations, with size of the circle proportional to sample size after removing clones. (a) Frequency of three alleles (H1, H2, H3) at a cpSSRs locus. (b) STRUCTURE and (c) GENELAND proportion of assignment to each genetic group within each sampling locality based on eight nSSRS. Assignment is represented at both the population (pay chart) and individual (right bar plot) levels
