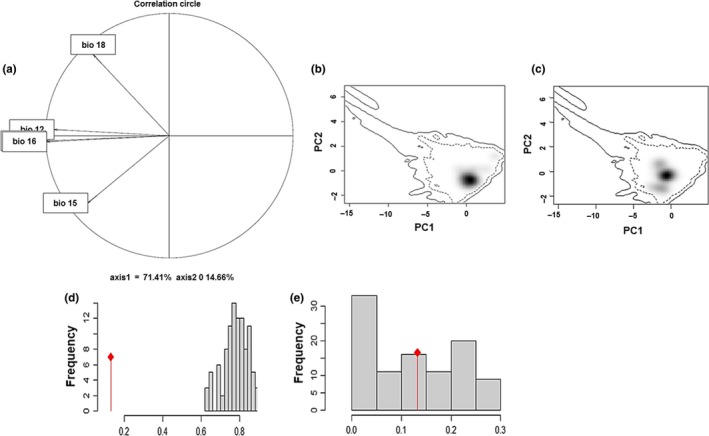
Figure 5.

Differentiation of niche space between the Lerma and Balsas basins. (a) Correlation circle and the direction of the arrows indicate the correlation of each variable to each of the two principal components. (b) Occurrence density surfaces for the Lerma Basin and c) the Balsas Basin. The shaded area represents the density of environmental space. Niche equivalency (d) and niche similarity (e) test results. The similarity between two probability surfaces, measured by Hellinger's D, is shown. Values of D on the x‐axis and the corresponding histogram represent the expected distribution based on the randomization of the data under different null models. The first null model randomizes the identities of the records from the two basins (equivalency test), and the second one (similarity test) randomizes the distribution of the samples of each of the two basins within their accessibility area. The observed D value is shown by the red diamond
