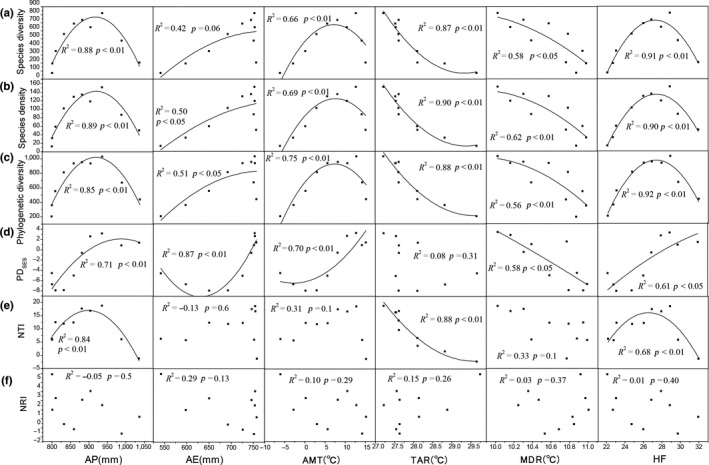
Figure 4.

The changes in species diversity (a), species density (b), phylogenetic diversity (c), PDSES (d), NTI (e), and NRI (f) as functions of different factors of climate and human activities. To account for the nonlinear relationships, quadratic polynomial models were used. AE, annual evapotranspiration; AMT, annual mean temperature; AP, annual precipitation; HF, human footprint; MDR, mean diurnal range of temperature; TAR, temperature annual range
