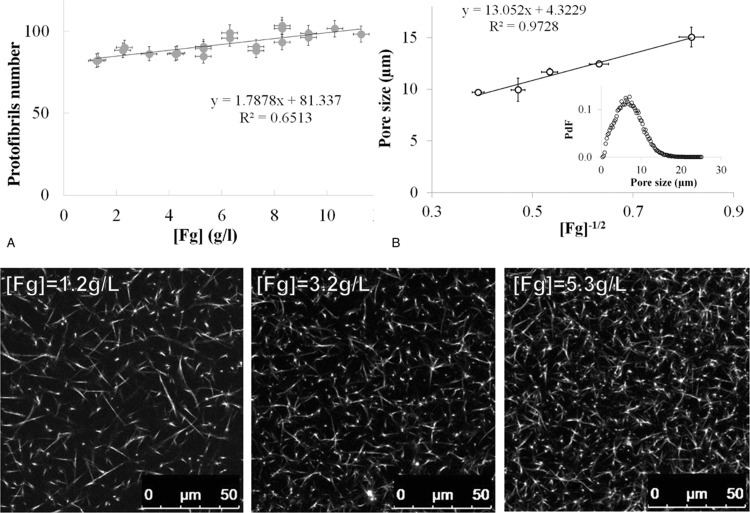
Figure 5.
Effect of fibrinogen concentration of Fibrinography. The 50% diluted normal plasma pool was spiked with purified fibrinogen in order to generate fibrinogen concentrations ranging from 1.2 (diluted plasma) to 11.3 g/L. Plasma was coagulated at 37°C as described in the Materials and Methods Section with 2 pM TF, 4 μM PL, and 16.7 mM CaCl2. (A) Final protofibrils number as a function of fibrinogen concentration (mean ± SD). Bottom panel: Confocal microscopy images obtained for selected concentrations of fibrinogen. (B) Confocal microscopy images were analyzed according to Munster and Fabry23 to determine the pore sizes inside the fibrin clots (mean ± SD). A typical histogram of pore size is represented in the inset. PdF = pore size probability distribution function.

