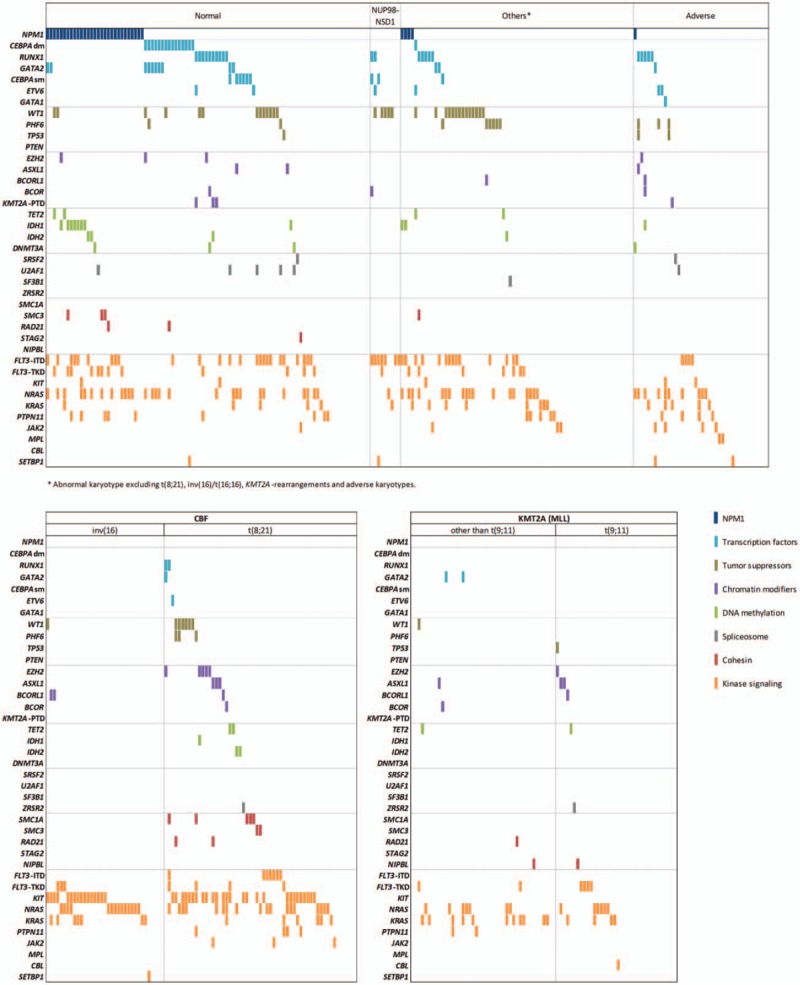
Figure 3.

Genomic landscape of childhood AML. Each column represents the mutation pattern in one individual patient and each colored box represents a gene mutation. Genes are groups in 8 categories (in decreasing order): (1) NPM1; (2) transcription factors; (3) tumor suppressors; (4) chromatin modifiers; (5) DNA methylation; (6) spliceosome; (7) cohesin complex; (8) kinase signaling. The first row at the top represents the cytogenetic subgroup for each patient. Patients with NUP98–NSD1 are distributed among normal karyotype (n = 5) and abnormal karyotype “other” (n = 4).
