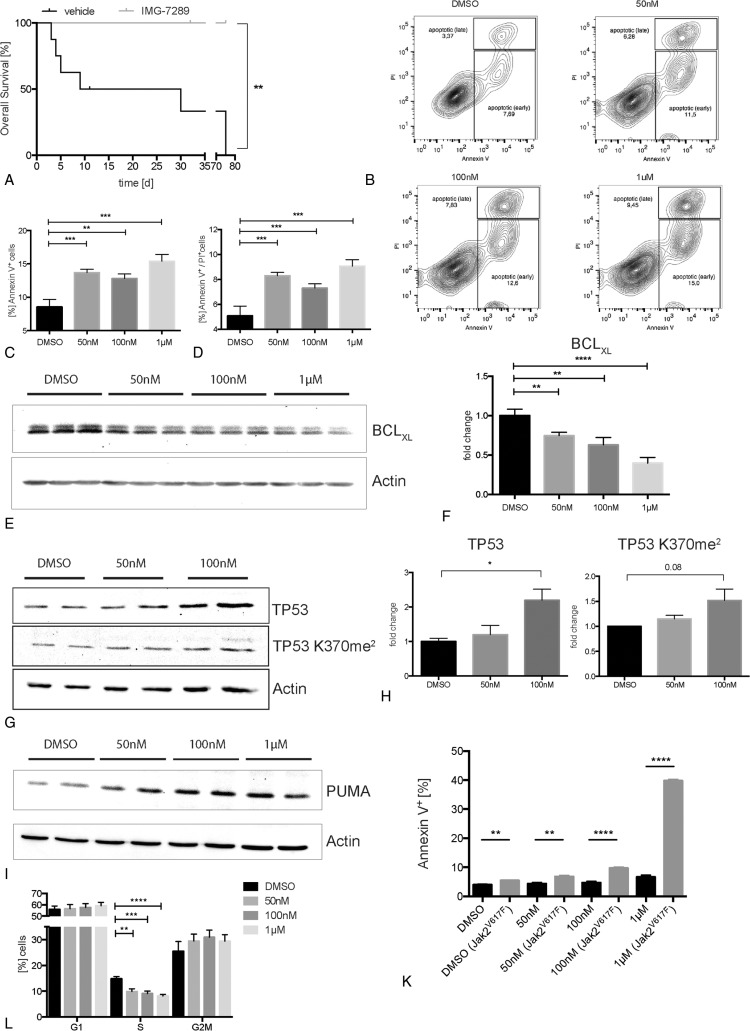
Figure 4.
LSD1 inhibition with IMG-7289 enhances survival, induces apoptosis via BCLXL and PUMA in a TP53-dependent manner, and leads to cell cycle arrest. (A) Overall survival of Jak2V617F mice treated with IMG-7289 in an advanced stage of disease. Statistical analysis was conducted using Log-rank (Mantel-Cox) test. (B–F) SET-2 cells, treated either with DMSO or 50 nM, 100 nM, and 1 μM IMG-7289, respectively. n = 3 independent experiments, each performed in triplicate. (B) Representative FACS plots of SET-2 cells stained for Annexin V/PI, after 96 hours of treatment. (C + D) Quantification of apoptosis shown in (B) detected by either Annexin V (C) or Annexin V and PI staining (D). (E) Representative western blot showing BCLXL protein levels (top) and actin as loading control (bottom) of treated SET-2 cells. (F) Quantification of BCLXL protein levels shown in (E). (G) Representative western blot showing protein levels of TP53 (top) and TP53 K370me2 (middle) and actin as loading control (bottom) in treated SET-2 cells. (H) Quantification of TP53 and TP53 K370me2 (middle) protein levels, shown in (G). (I) Representative western blot showing PUMA protein levels (top) and actin as loading control (bottom) of treated HEK293 cells. (K) Quantification of apoptosis in cocultures of Baf/3 wild type and Baf/3 Jak2V617F cells, treated with IMG-7289 or a DMSO control, detected with FACS by Annexin V staining. n = 2 independent experiments (each in duplicate). (L) Hoechst-based cell cycle analysis of treated SET-2 cells. n = 2 independent experiments (each in triplicate). (C, D, F, H, I, K) Mean and standard error of mean are shown. Statistical analysis was conducted using Student t tests. ∗P < 0.05, ∗∗P < 0.01, ∗∗∗P < 0.001, and ∗∗∗∗P < 0.0001.

