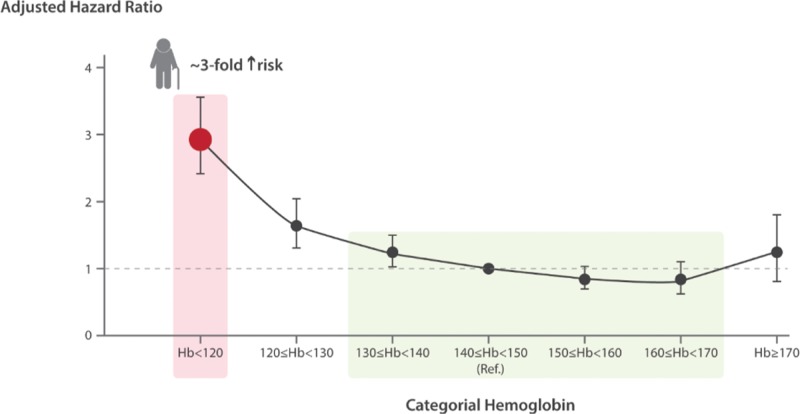
Figure 1.
Curve of mortality risk per Hb categories in men aged > 66 years from the Calgary Community. The curve is J-shaped, with optimal Hb levels minimizing the risk ranging from 140 to 170 g/L (green area). Red point and arrow indicate how the patient described in the case vignette is positioned in the curve, with an ensuing mortality risk increased by 3-fold. ∗Adjusted for age, diabetes mellitus, glomerular filtration rate, and comorbidity status calculated using a validated chronic disease score. See also discussion on the “Definition of AE: a still unresolved issue,” “Prevalence of anemia in elderly: a public health problem,” and “Clinical relevance of anemia in elderly: not an innocent bystander” sections. Adapted from Culleton et al.14 In the original publication, the fully adjusted hazard ratio for mortality in all subjects (both men and women) older than 80 years with Hb < 110 g/L and normal glomerular filtration rate was 3.34, 95% confidence interval 2.47 to 4.51. Hb = hemoglobin.

