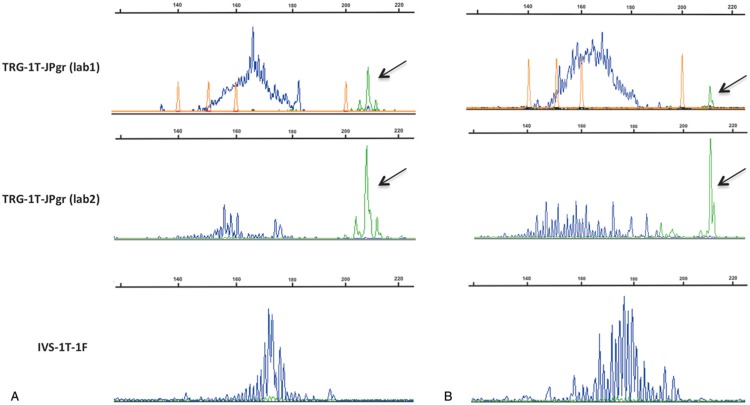
Figure 3.
Profiles of the TRG-1T-JPgr PCR assay in two cases (A and B) from a separately selected cohort of samples with canonical TRG-JP rearrangements. Difference in fluorochrome intensity between two laboratories (top and middle panels) identifies a potentially misleading over-amplification of the green dye in the second laboratory (middle panel). In the bottom panel, profiles of the IVS-1T-1F PCR assay are shown for reference. Canonical JP rearrangements (in green) are indicated by arrows.

