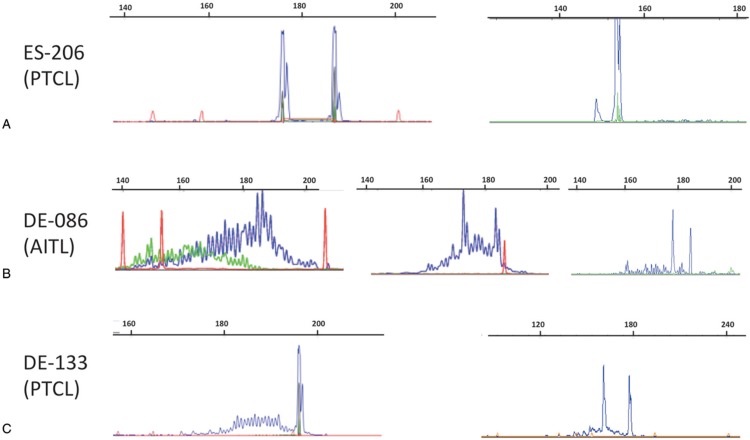
Figure 6.
Examples of discrepancies between one-tube TRG PCR assays. (A) Case ES-206 (PTCL) with bi-allelic rearrangements with the IVS-1T-1F PCR (left) and apparently only 1 rearrangement but possibly with 2 overlapping peaks in the TRG-1T-1F PCR (right). (B) Case DE-086 (AITL) with a polyclonal profile with the TRG-1T-2F PCR (left), and 2 peaks on a polyclonal background with both the IVS-1T-1F (middle) and TRG-1T-1F assays (right). (C) Case DE-133 (PTCL) with bi-allelic rearrangements with TRG-1T-1F PCR (right) and only 1 rearrangement but possibly with 2 overlapping peaks in the IVS-1T-1F PCR (left). Red peaks correspond to size markers.

