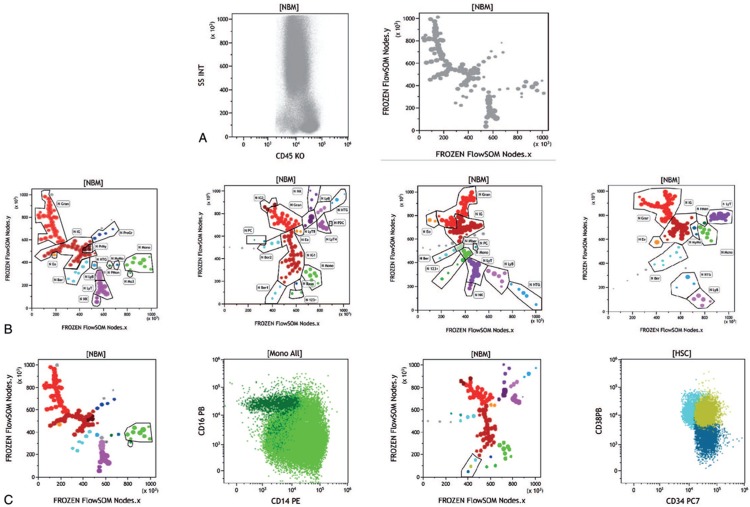
Figure 1.
Unsupervised delineation of human normal bone marrow. (A) Left: CD45/SSC representation of 19 normal merged bone marrow (BM) samples stained with acute myeloid leukemia (AML) panel B and acquired according to Harmonemia recommendations.5 Right: minimal spanning trees (MST) obtained after unsupervised multidimensional (11 dimensions) analysis by FlowSOM of the same population of 19 normal BM samples. Legend: 123+ = undefined CD123 population, Baso = basophils, Ber = bermudes, Ber1= bermudes 1, Ber2 = bermudes 2, Eo = eosinophils, Gran = granulocytes, HTG = hematogones, IG = immature gran (IG1, IG2), LyB = B cells, LyT = T cells (LyT CD4; LyT CD8), Mo = monocytes, Mo3 = nonclassical monocytes, MonoBer = monocyte progenitors, MyMo = myelomonocytes, NK = NK cells , PC = plasma cells, pDC = plasmacytoid DC, PrMo = promonocytes, PrMy = promyelocytes, ProGR = progenitor granulocytes. (B) Four different MST were obtained with the 2 AML and 2 acute lymphoblastic leukemia panels explored after merging the normal bone marrows stained with these antibodies. Node-by-node exploration of immunophenotypic characteristics of each isolated cell subset allowed to assign node clusters to specific hematopoietic populations. (C) Left: Focus on the monocytic cluster (light green) and the isolated node dubbed Mo3 (dark green) on the colored MST of AML-A stained normal merged BM. The biparametric representation of these gates shows the superimposition yet clear identification of nonclassical monocytes12 (CD14dim, CD16+) segregated by FlowSOM as Mo3. Right: colored MST of AML-B stained normal merged BM, with a focus on the tree nodes of immature progenitors (bermudes).5 The biparametric CD34/CD38 histogram shows the superimposition of the 3 subsets13, respectively, CD34+CD38− (dark blue), CD34+CD38+ (gold), and CD34loCD38+ (cyan). In this classical representation, manual gating would be highly subjective while whole FlowSOM clearly delineates 3 nodes.

