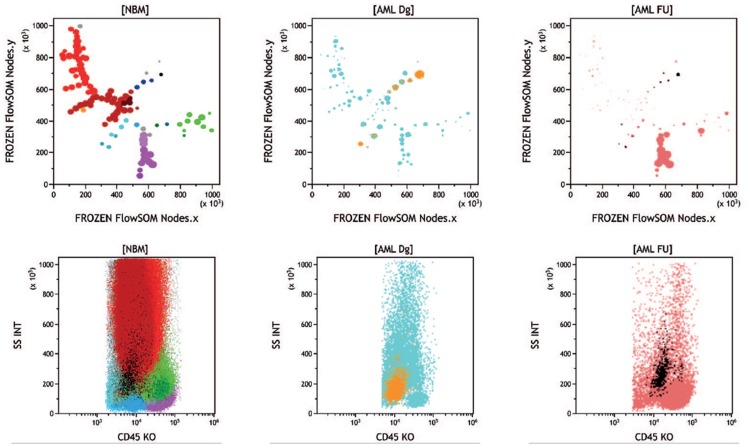
Figure 2.
Unsupervised analysis of diagnosis and follow-up samples from an AML patient. Normal merged BM and patient's samples stained with the AML-A antibody combinations; the middle top panel shows the diagnosis sample; the top right panel shows a follow-up sample with measurable residual disease. The bottom panels display the CD45/SSC patterns of the respective MST. The diagnosis sample shows, by comparison with the reference normal BM MST, a severe disappearance of granulocytic maturation and near complete disappearance of monocytic maturation, also identifiable, but more roughly, in the corresponding CD45/SSC histogram. The blasts cluster (13.7%), which appears as a single population in the CD45/SSC histogram is in fact segregated in several nodes in the corresponding MST (golden nodes). In the follow-up sample, the lymphoid compartment is still predominant. Although in smaller proportion (1.44%), remaining blasts are in the same position as at diagnosis (black nodes). Of note, the same nodes are present in normal bone marrow but represent only 0.18% of leukocytes and appear as a scattered population on the CD45/SSC scattergram. This sample is representative of 20 patients whose diagnosis and follow-up have been performed with the same panel and successfully submitted to FlowSOM analysis (data not shown). BM = bone marrow, MST = minimal spanning trees.

