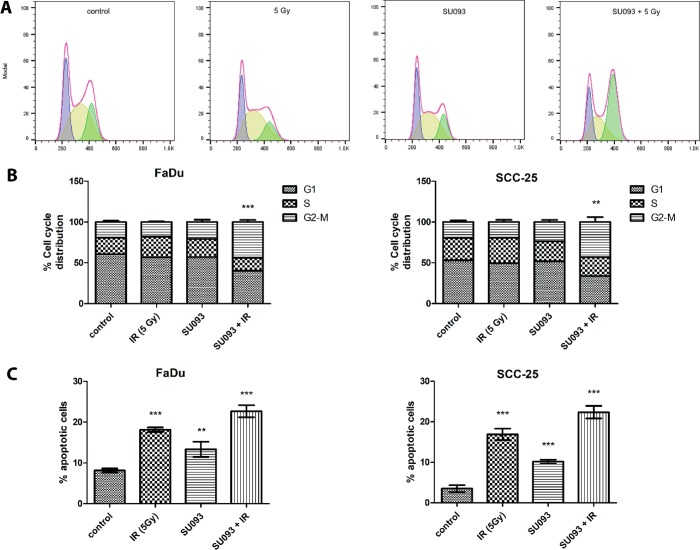
Figure 3.
(A) Representative cell cycle distribution of FaDu cells for each condition from left to right; control, 5 Gy, SU093, and combined 0.5 μM SU093 and 5 Gy of ionizing radiation. (B) Cell cycle distribution of FaDu and SCC-25, respectively, for each condition. Asterisks indicate t test comparison between combined treatment and control for G2/M distribution, where P < 0.001 or P < 0.01. (C) Percentage of apoptotic cells post 48 h treatments of FaDu and SCC-25 in each conditions control, 5 Gy of IR, 0.5 μM SU093, and combined treatment. Asterisks indicate t test comparison between each treatment and control, where ***P < 0.001 or **P < 0.01.

