
Figure 1.
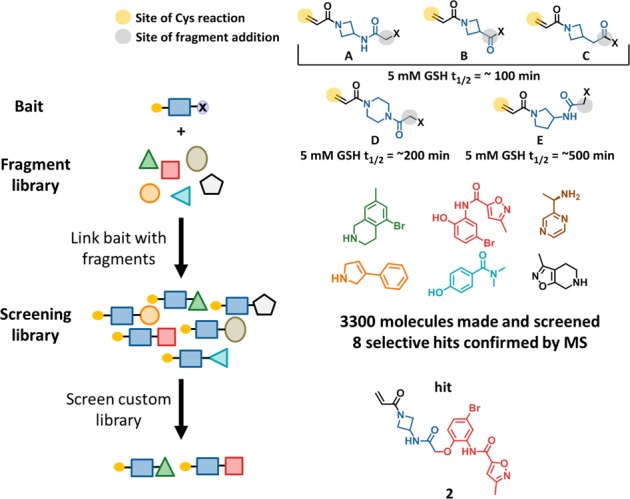
Chemotype Evolution leading to the discovery of 2. Yellow circle in top right illustrates reactive site of the acrylamide, blue illustrates the spacing element, and black indicates the reactive handle that can be coupled to individual fragments, examples of which are shown above. GSH half-life values shown are representative of bait-fragment conjugates.