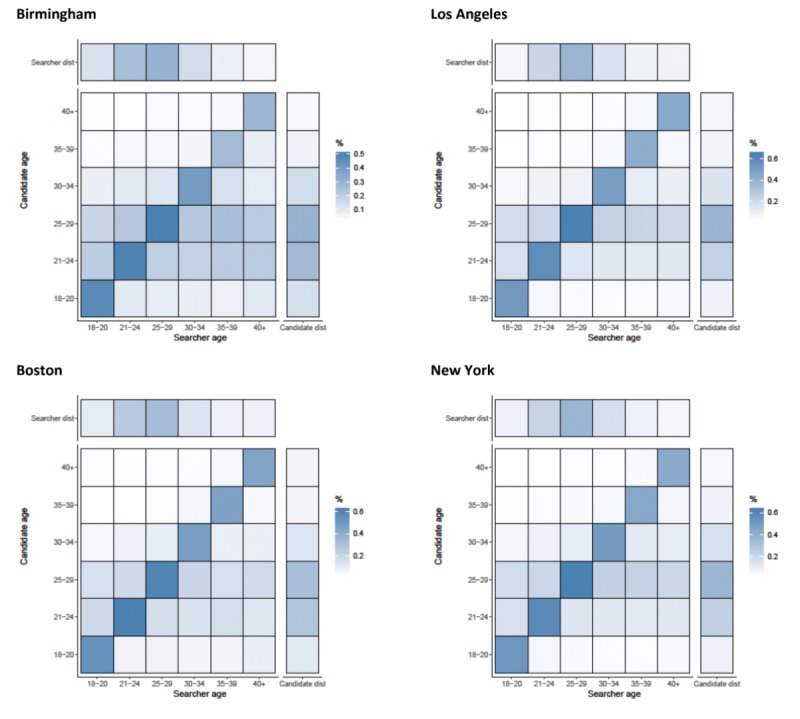
Figure 2.

Assortativity by age (years) for details that are acquired by searchers on candidates in Birmingham, Los Angeles, Boston, and New York. Heat maps show the relationship between searcher’s age band and the candidate’s age band. All values are normalized by numbers of searchers in each age category (the total value of a column adds up to 100%). Besides each heat map, a column representing the distribution of candidates in the age band and above each heat map, a row representing the distribution of searchers is shown.
