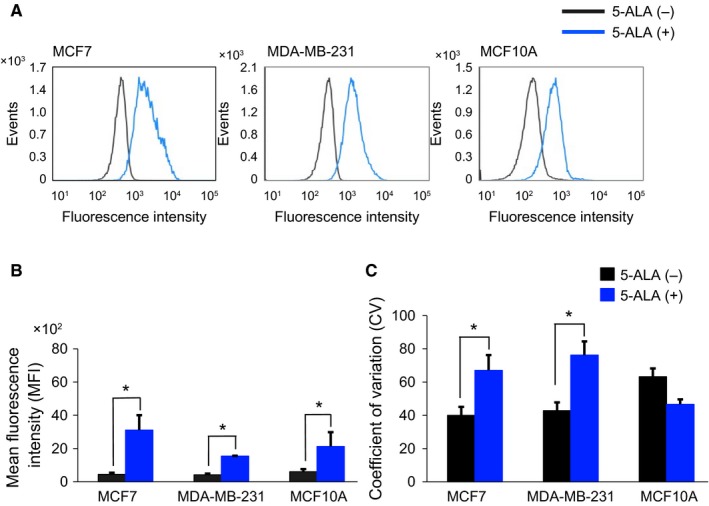
Figure 2.

Flow cytometric analyses of 5‐ALA–induced PpIX‐FI for MCF7, MDA‐MB‐231, and MCF10A cells. (A), Representative histograms of autofluorescence intensity and 5‐ALA–induced PpIX‐FI after 2 h of exposure. (B), Mean FI of 5‐ALA–induced PpIX (mean and SD) after 2 h of incubation. (C), Coefficient of variation (CV) for 5‐ALA–induced PpIX‐FI after 2 h of incubation. All experiments were performed in triplicate. *P < .05 compared with the corresponding autofluorescence
