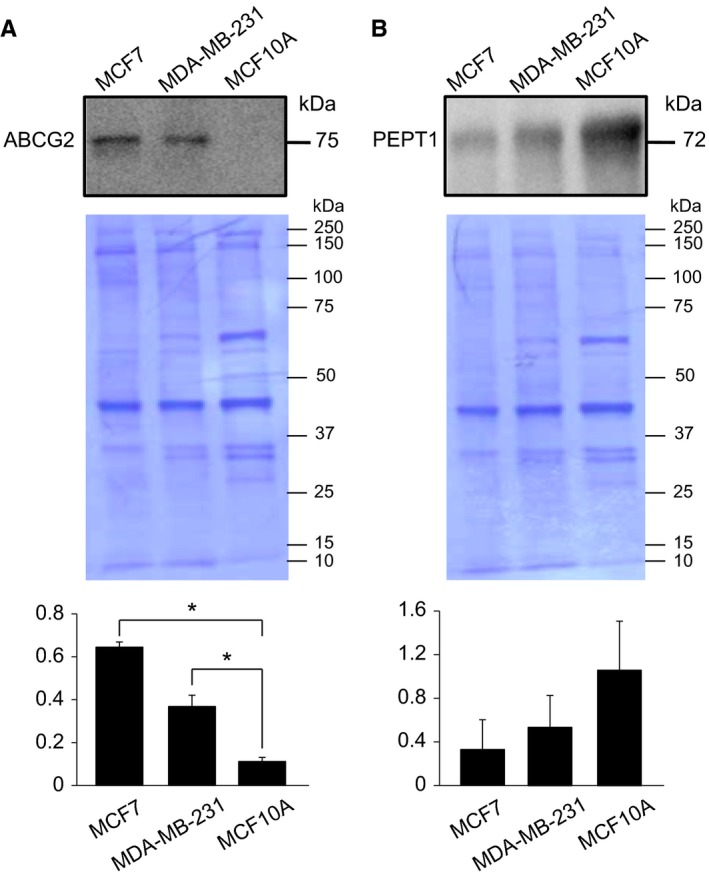
Figure 3.

Whole cell lysates were subjected to immunoblotting with anti‐ABCG2 (A, top panel) or PEPT1 antibody (B, top panel), followed by total protein staining (A, B, middle panels). Data are representative of three independent experiments. Graphs present the ratios of signal intensity on the immunoblot to total protein staining (n = 3, mean ± SD). *Statistically significant difference on the basis of Bonferroni's multiple comparison (P < .05)
