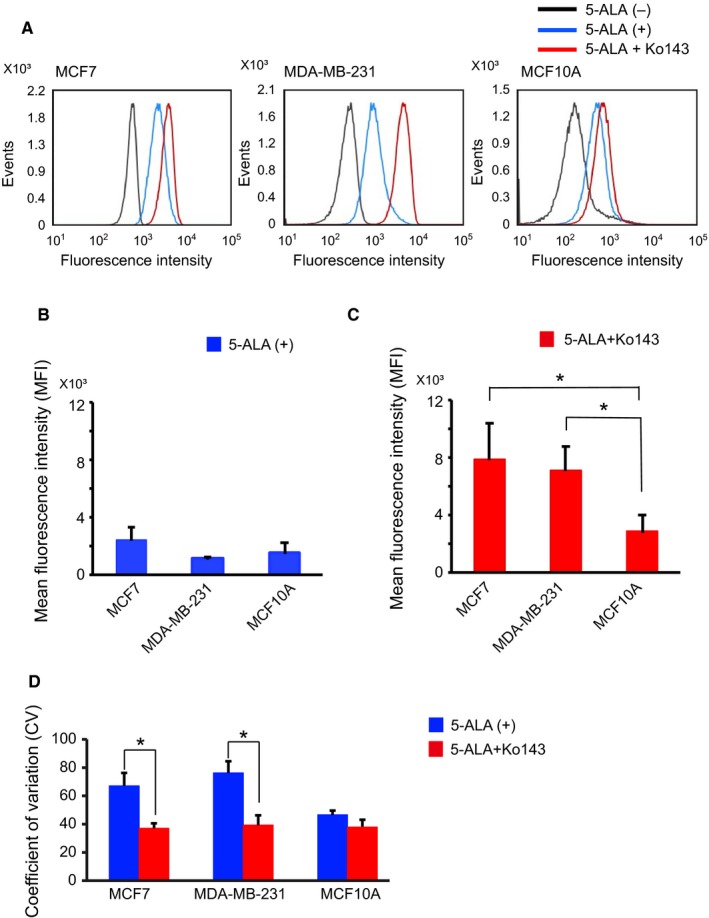
Figure 5.

Flow cytometric analysis of Ko143 effect on PpIX‐FI of MCF7, MDA‐MB‐231, and MCF10A cells after 2 h of incubation. (A), Representative histograms of PpIX‐fluorescence with or without exposure to Ko143. (B), Mean FI of 5‐ALA‐PpIX‐FI after subtracting the FI without 5‐ALA. (C), Effects of Ko143 on the mean PpIX‐FI after subtracting the FI without 5‐ALA. *Statistically significant difference on the basis of Bonferroni's multiple comparison (P < .05). (D), Effects of Ko143 on the CV of PpIX‐FI. All error bars represent SD (n = 3). *P < .05
